
Penerangan
Lengkapkan strategi anda dengan penunjuk isyarat ini👇🏻
https://ctrader.com/pt/products/1560?u=Goulart
✔Ciri-ciri Penunjuk
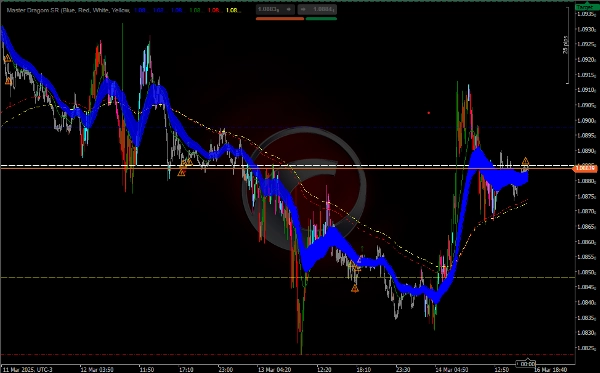
Sokongan dan Rintangan (SR):
Penunjuk melukis garis mendatar untuk tahap sokongan dan rintangan harian, mingguan, dan bulanan.
Anda boleh mengaktifkan atau mematikan setiap tahap (buka, tutup, tinggi, dan rendah) mengikut keperluan.
Purata Pergerakan Eksponen (EMA):
Penunjuk mengira pelbagai EMA (50, 25, 200, dan 233 tempoh) untuk membantu mengenal pasti trend dan kawasan sokongan/rintangan dinamik yang berpotensi.
EMA dilukis pada carta dalam warna yang berbeza untuk memudahkan pemerhatian.
Analisis Isipadu (PVAVolumeAnalysis):
Penunjuk menganalisis isipadu untuk mengenal pasti kemungkinan pembalikan atau kesinambungan trend.
Ia menyerlahkan bar dengan isipadu melebihi purata dan memberi isyarat perubahan penting dalam isipadu dengan ikon (↑, ↓, ⚠️).
Pewarnaan Bar:
Bar diwarnakan berdasarkan isipadu dan arah harga (naik atau turun), yang membantu mengenal pasti kekuatan trend.
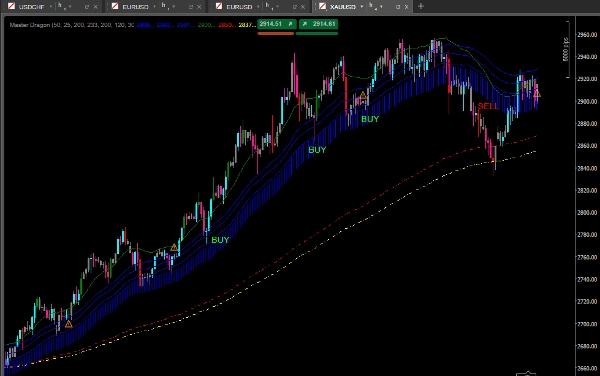
Analisis Trend dengan EMA:
Gunakan EMA untuk mengenal pasti arah trend:
Jika harga berada di atas EMA (terutamanya EMA 200 dan 233), trend adalah menaik.
Jika harga berada di bawah EMA, trend adalah menurun.
Kawasan antara EMA 50 Tinggi dan Rendah boleh digunakan sebagai zon minat untuk kemungkinan pembalikan atau kesinambungan.
Analisis Isipadu:
Perhatikan ikon dan warna bar untuk mengenal pasti perubahan dalam isipadu:
Isipadu tinggi dengan harga meningkat (↑): Pengesahan trend menaik.
Isipadu tinggi dengan harga menurun (↓): Pengesahan trend menurun.
Isipadu rendah dengan harga meningkat atau menurun (⚠️): Kemungkinan pembalikan.
Menggabungkan Isyarat:
Gabungkan isyarat isipadu, EMA, dan tahap SR untuk membuat keputusan masuk atau keluar.
Sebagai contoh, jika harga hampir dengan tahap rintangan dan isipadu menurun, ia boleh menjadi isyarat pembalikan.
Strategi Dicadangkan
Strategi Trend dengan Pengesahan Isipadu
Kenal pasti Trend:
Gunakan EMA (200 dan 233) untuk menentukan trend utama.
Jika harga berada di atas EMA, pertimbangkan hanya pembelian.
Jika harga berada di bawah EMA, pertimbangkan hanya penjualan.
Tunggu Tarikan Balik:
Tunggu harga kembali ke EMA tempoh lebih pendek (50 atau 25) atau ke tahap SR.
Sahkan dengan Isipadu:
Periksa jika isipadu meningkat mengikut arah trend (↑ untuk pembelian, ↓ untuk penjualan).
MA mengenal pasti trend, tarikan balik, isyarat isipadu, pembalikan, sokongan dan rintangan.
Jika isipadu menurun (⚠️), elakkan masuk atau pertimbangkan pembalikan.
Masuk:
Beli apabila harga berada di atas EMA dan hampir dengan tahap sokongan, dengan isipadu mengesahkan trend menaik.
Jual apabila harga berada di bawah EMA dan berhampiran tahap rintangan, dengan isipadu mengesahkan trend menurun.
Keluar:
Gunakan tahap SR atau EMA sebagai sasaran atau titik keluar.
Sebagai contoh, tutup atau jual apabila ia mencapai tahap sokongan.
Ringkasan
Volume analysis is integrated to detect potential trend reversals or continuations by highlighting bars with above-average volume and signaling significant volume changes using icons (↑ for rising volume confirming uptrends, ↓ for falling volume confirming downtrends, and ⚠️ for low volume indicating possible reversals). Bars are color-coded based on volume and price direction to visually represent trend strength.
Traders can combine signals from volume, EMAs, and support/resistance levels to make informed entry and exit decisions. A suggested strategy involves identifying the main trend using the 200 and 233 EMAs, waiting for pullbacks to shorter EMAs or support/resistance levels, and confirming with volume signals before entering trades. Exit points can be set at support/resistance levels or EMA lines. This indicator is suitable for enhancing trend, pullback, volume, reversal, and support/resistance analysis in various trading strategies.
Ulasan pelanggan
5 | 100 % | |
4 | 0 % | |
3 | 0 % | |
2 | 0 % | |
1 | 0 % |


