
Penerangan
PVA (Analisis Harga-Isipadu) adalah pendekatan analisis teknikal yang mengkaji hubungan antara harga dan isipadu dagangan sesuatu aset kewangan. Idea utama di sebalik PVA ialah isipadu dagangan boleh memberikan maklumat penting tentang kekuatan dan arah sesuatu tren, membantu pedagang membuat keputusan yang lebih bermaklumat.
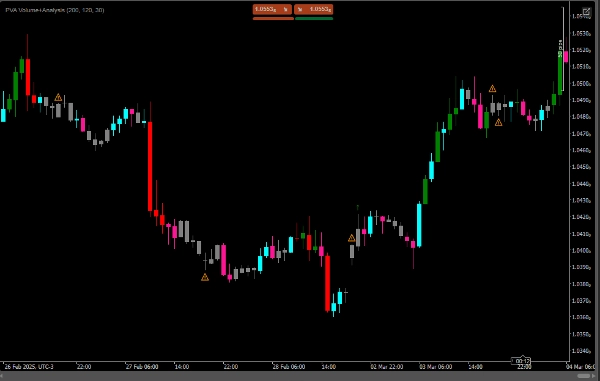
-Isipadu meningkat dengan harga yang naik: Menunjukkan tren menaik yang kuat, dan simbol hijau (anak panah ke atas) dipaparkan.
-Isipadu meningkat dengan harga yang jatuh: Menunjukkan tren menurun yang kuat, dan simbol merah (anak panah ke bawah) dipaparkan.
-Isipadu menurun dengan harga yang naik: Menunjukkan bahawa tren menaik mungkin kehilangan kekuatan, dan amaran oren (simbol amaran) dipaparkan.
-Isipadu menurun dengan harga yang jatuh: Menunjukkan bahawa tren menurun mungkin kehilangan kekuatan, dan amaran oren (simbol amaran) juga dipaparkan.
-Jika isipadu menurun dalam pergerakan menaik atau menurun, tanda amaran (⚠️) dilukis.
Ringkasan
- A green up arrow appears when volume increases alongside rising prices, indicating a strong uptrend.
- A red down arrow signals a strong downtrend when volume increases as prices fall.
- An orange warning symbol alerts when volume decreases during rising or falling prices, suggesting the current trend may be weakening.
- A general alert mark (⚠️) is displayed if volume declines during either upward or downward price movements.
This indicator assists traders by highlighting the interplay between price and volume, offering insights into the momentum behind market trends. It is designed for use in technical analysis to support more informed trading decisions.
Ulasan pelanggan
5 | 100 % | |
4 | 0 % | |
3 | 0 % | |
2 | 0 % | |
1 | 0 % |


