
Penerangan
Trend Entropy – Penunjuk cTrader Percuma
Entropi adalah ukuran saintifik bagi kekacauan atau ketidakpastian dalam sesuatu sistem. Dalam fizik, ia menunjukkan bagaimana tenaga tersebar dan mengapa sistem bergerak ke arah kekacauan. Dalam teori maklumat, ia mengukur ketidakbolehjangkaan dalam data. Entropi rendah bermaksud susunan dan kebolehramalan, manakala entropi tinggi mencerminkan kebetulan, kerumitan, dan pengurangan kejelasan hasil.
Temui kuasa susunan dalam kekacauan. Trend Entropy adalah penunjuk teknikal terkini yang direka untuk mengukur organisasi berbanding kebetulan dalam pergerakan harga. Berbeza dengan osilator tradisional yang hanya mengesan momentum atau volatiliti, Trend Entropy menggunakan pengiraan entropi lanjutan untuk mendedahkan sama ada pasaran sedang tren secara teratur atau hanyut ke dalam tingkah laku julat yang kacau.
Alat percuma ini dibina untuk pedagang yang mahukan pandangan lebih mendalam ke dalam dinamik tersembunyi tindakan harga. Dengan menggabungkan entropi statistik dengan pelicinan gaya RSI dan ambang adaptif, Trend Entropy mengubah volatiliti mentah menjadi skala normal dari 0% hingga 100%. Hasilnya adalah satu garis elegan yang memberitahu anda sama ada pasaran berada dalam tren kuat, konsolidasi neutral, atau julat yang tidak stabil.
Cara Membaca Trend Entropy
Nilai rendah (0–33%): Pasaran teratur. Jika pulangan purata positif, ia menunjukkan kemungkinan tren menaik. Jika negatif, ia menandakan kemungkinan tren menurun.
Nilai pertengahan (34–66%): Kawasan neutral. Pasaran mungkin sedang konsolidasi, dengan sedikit kecenderungan ke arah bullish atau bearish bergantung pada pulangan purata.
Nilai tinggi (67–100%): Kekacauan menguasai. Tindakan harga berada dalam julat, tidak dapat diramalkan, dan kurang boleh dipercayai untuk strategi mengikuti tren.
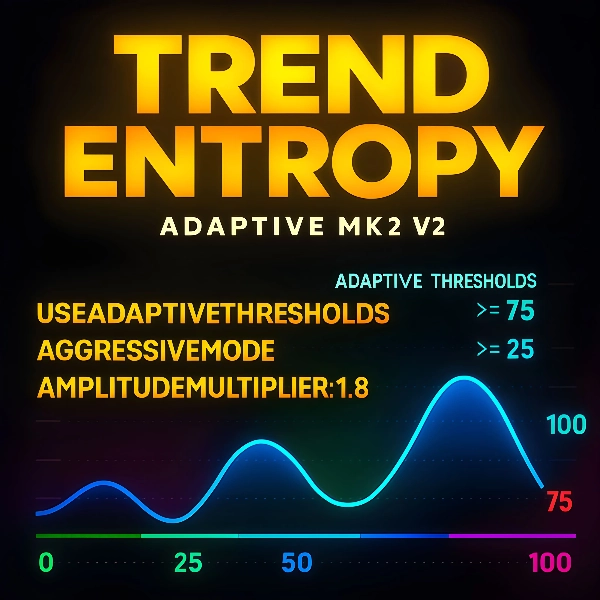
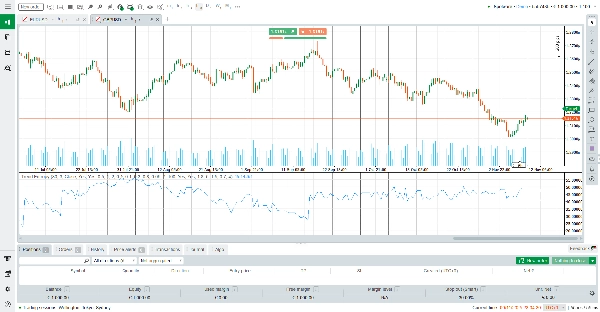
Garis rujukan mendatar pada 25%, 50%, dan 75% memudahkan tafsiran. Pedagang boleh segera melihat sama ada entropi sedang memampat ke arah susunan atau berkembang ke arah kekacauan.
Cara Penunjuk Berfungsi
Trend Entropy mengira pulangan dalam tempoh yang dipilih dan memetakannya ke dalam keadaan simbolik. Keadaan ini dianalisis dalam tetingkap bertindih untuk membina taburan kekerapan corak harga. Menggunakan matematik entropi, penunjuk mengukur tahap kekacauan dalam urutan ini.
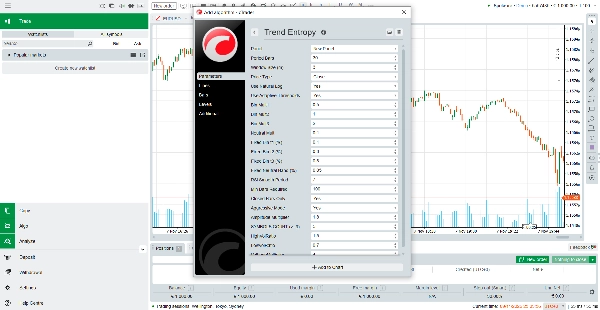
Untuk menjadikan output praktikal, entropi mentah dinormalisasi ke skala peratusan dan kemudian dilicinkan menggunakan kaedah purata gaya Wilder. Ambang adaptif memastikan penunjuk menyesuaikan diri dengan volatiliti semasa, manakala mod agresif memperkuat isyarat untuk pedagang yang lebih suka tindak balas tajam. Akhir sekali, nisbah volatiliti digunakan untuk memperhalusi bacaan, menolak nilai lebih tinggi dalam keadaan kacau dan lebih rendah dalam keadaan stabil.
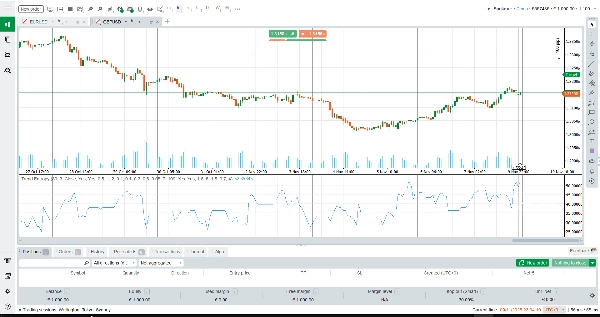
Hasil akhirnya adalah satu garis licin yang menangkap inti struktur pasaran: sama ada harga sedang tren dengan susunan atau hanyut ke dalam kebetulan.
Ciri-ciri Utama
Analisis berasaskan entropi – Melangkaui momentum untuk mengukur organisasi sebenar tindakan harga.
Ambang adaptif – Secara automatik menyesuaikan dengan volatiliti, memastikan isyarat relevan dalam semua keadaan pasaran.
Pelicinan gaya RSI – Menyediakan garis yang bersih dan stabil yang mengelakkan turun naik bising.
Integrasi volatiliti – Meningkatkan ketepatan dengan membandingkan nisbah volatiliti jangka pendek dan jangka panjang.
Reka bentuk visual jelas – Tahap rujukan mendatar dan satu garis DodgerBlue memudahkan tafsiran.
Mengapa Memilih Trend Entropy?
Trend Entropy bukan sekadar osilator biasa. Ia adalah alat hibrid yang menggabungkan ketelitian statistik dengan visualisasi mesra pedagang. Sama ada anda seorang pengikut tren yang mencari pengesahan, atau pedagang julat yang ingin mengelakkan pasaran kacau, penunjuk ini memberi anda kejelasan yang anda perlukan.
Ringkasan
The indicator outputs a single smoothed line on a normalized scale from 0% to 100%, where low values (0–33%) indicate organized trending markets, mid values (34–66%) suggest neutral or consolidating conditions, and high values (67–100%) reflect chaotic, ranging markets. Horizontal reference lines at 25%, 50%, and 75% aid interpretation.
Trend Entropy pro incorporates RSI-style smoothing, adaptive thresholds that adjust to current volatility, and volatility ratio integration to enhance signal accuracy. It is designed to provide traders with deeper insight into market dynamics beyond traditional momentum or volatility indicators, supporting analysis across various markets including Forex, cryptocurrencies, commodities, indices, and stocks.
This indicator is suitable for traders seeking to identify trending versus ranging conditions and improve decision-making in trend-following or range-trading strategies.


