Beschreibung
Trend Pulse X
Der Trend Pulse X ist ein trendfolgender Indikator, der entwickelt wurde, um eine klare Sicht auf Marktrichtung, Momentum und Stärke zu bieten. Im Gegensatz zu Indikatoren, die unregelmäßige Signale anzeigen können, erzeugt dieses Tool eine kontinuierliche, adaptive Linie, die dynamisch auf die Kursbewegung reagiert und eine konsistente Referenz im Chart bietet.
Wie es funktioniert
Der Indikator kombiniert zwei analytische Konzepte:
ATR (Average True Range): misst die Volatilität. Höhere ATR-Werte vergrößern den Abstand zwischen Preis und Indikatorlinie und spiegeln stärkere Schwankungen wider.
ADX (Average Directional Index): misst die Trendstärke. Wenn der ADX unter einem gewählten Schwellenwert liegt (Standard = 25), gelten die Bedingungen als schwächer oder seitwärts verlaufend.
Durch die Kombination dieser Faktoren hebt Trend Pulse X sowohl die Richtung der Kursbewegung als auch die relative Stärke des zugrunde liegenden Trends hervor.
Farbkodierte Interpretation
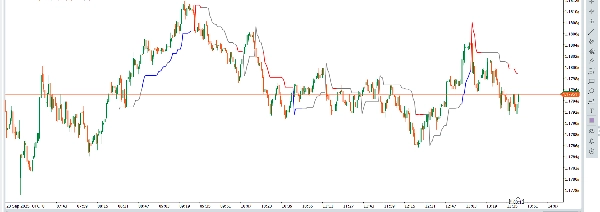
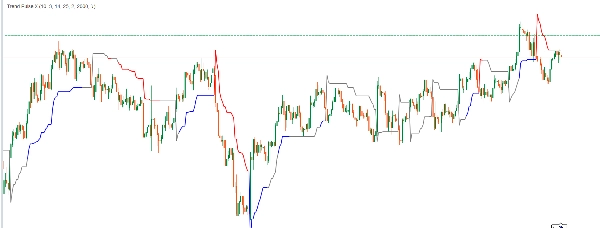
Blaue Linie: zeigt einen starken Aufwärtstrend an.
Rote Linie: zeigt einen starken Abwärtstrend an.
Graue Linie: zeigt schwächere oder seitwärts verlaufende Bedingungen an.
Die kontinuierliche Linie ändert automatisch die Farbe, was den Nutzern hilft, Marktphasen schnell zu interpretieren.
Interpretation des Indikators
Eine blaue Linie unter dem Preis deutet auf Aufwärtsdynamik hin.
Eine rote Linie über dem Preis deutet auf Abwärtsdynamik hin.
Eine graue Linie deutet auf Konsolidierung oder Unentschlossenheit hin.
Die Linie kann auch als dynamische Referenz für Unterstützung/Widerstand oder als Trendfilter innerhalb umfassenderer Strategien dienen.
Hauptmerkmale
Kontinuierliches, lückenloses Design für eine flüssigere Chartinterpretation.
Integration von ATR und ADX für eine kombinierte Volatilitäts- und Trendanalyse.
Dynamische Farbgebung für schnelle Erkennung von Marktphasen.
Einsetzbar in verschiedenen Handelsstilen (Scalping, Intraday, Swing).
Zusammenfassung
The line changes color to reflect market conditions: blue indicates a strong upward trend, red signals a strong downward trend, and gray denotes weaker or sideways movement. Positioning of the line relative to price helps interpret momentum—blue below price suggests upward momentum, red above price indicates downward momentum, and gray reflects consolidation or indecision.
Trend Pulse X can be used as a dynamic support/resistance reference or as a trend filter within various trading strategies. It supports multiple trading styles including scalping, intraday, and swing trading. The indicator is applicable across markets such as Forex, cryptocurrencies, commodities, and stocks.
Kundenbewertungen
5 | 0 % | |
4 | 100 % | |
3 | 0 % | |
2 | 0 % | |
1 | 0 % |


