
Daily Open Color Zones
อินดิเคเตอร์
346 ดาวน์โหลด
เวอร์ชัน 1.0, Sep 2025
Windows, Mac
4.0
รีวิว: 1
คำอธิบาย
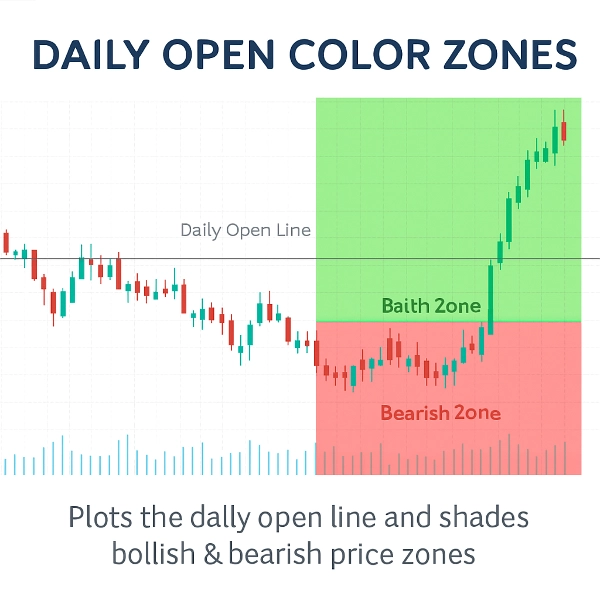
ตัวบ่งชี้นี้จะแสดงเส้นเปิดรายวันและแรเงาโซนราคาขาขึ้นและขาลงรอบ ๆ เส้นนั้น
มันให้การอ้างอิงภาพที่ชัดเจนเพื่อดูว่าตลาดกำลังซื้อขายเหนือหรือใต้ราคาเปิดรายวัน ซึ่งเป็นระดับที่ใช้กันทั่วไปในการวิเคราะห์ภายในวัน
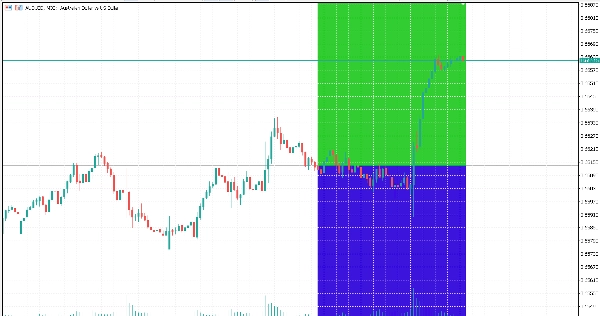
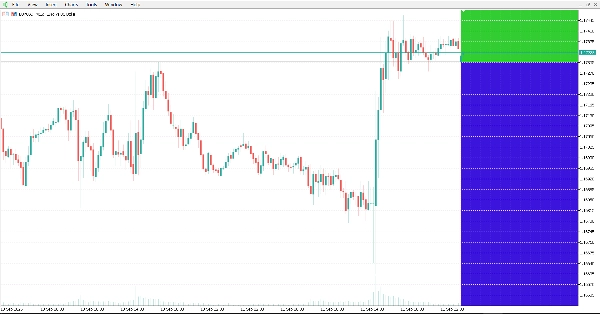
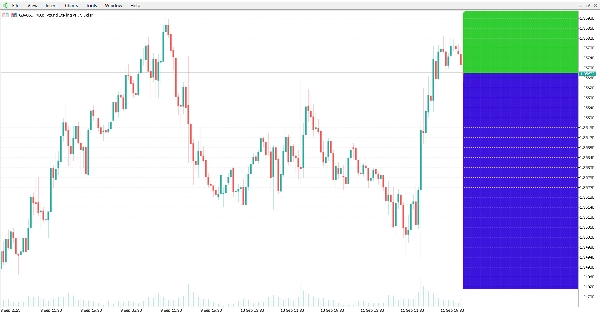
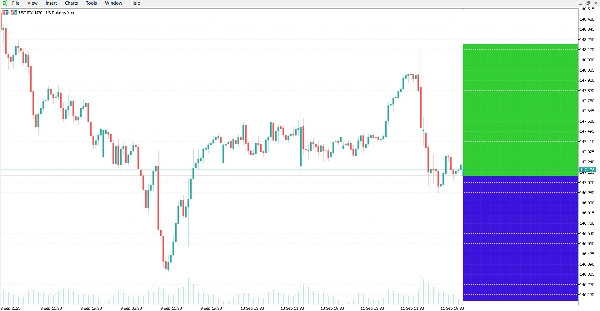
ตัวบ่งชี้จะวาดเส้นแนวนอนที่ราคาเปิดรายวันโดยอัตโนมัติและเน้นพื้นที่บนแผนภูมิ:
- โซนสีเขียวเหนือเส้น (พื้นที่ขาขึ้น)
- โซนสีแดงใต้เส้น (พื้นที่ขาลง)
คุณสมบัติ:
- เส้นเปิดรายวันอัตโนมัติ: การวางเส้นราคาเปิดรายวันที่แม่นยำ
- โซนสี: แยกแยะพื้นที่ขาขึ้นและขาลงได้ง่ายด้วยสีที่ปรับแต่งได้
- อัปเดนแบบไดนามิก: โซนจะปรับโดยอัตโนมัติเมื่อมีแท่งเทียนใหม่
- รูปลักษณ์ที่ปรับแต่งได้: สามารถแก้ไขสไตล์เส้น ความหนา และสีของโซนได้
- น้ำหนักเบาและมีประสิทธิภาพ: ออกแบบมาเพื่อใช้ CPU น้อยที่สุด
- ใช้งานได้กับสัญลักษณ์และกรอบเวลาทุกประเภท
บทสรุป:
ตัวบ่งชี้นี้ให้ภาพแผนภูมิที่ชัดเจนของราคาเปิดรายวันและโซนขาขึ้น/ขาลงที่เกี่ยวข้อง สามารถนำไปใช้กับตลาดและกรอบเวลาต่าง ๆ สำหรับการวิเคราะห์ทางเทคนิค
สรุป
สรุปโดย AI
The Daily Open Color Zones indicator visually marks the daily open price on trading charts by automatically plotting a horizontal line at this level. It shades the price area above the daily open line in green to indicate bullish zones and the area below in red to indicate bearish zones. These color-coded zones update dynamically with each new candle, providing real-time visual cues about market direction relative to the daily open. The indicator supports all symbols and timeframes, making it applicable across various markets including Forex, cryptocurrencies, and commodities like gold (XAUUSD). Users can customize the line style, thickness, and zone colors to suit their preferences. Designed to be lightweight, it minimizes CPU usage while offering clear intraday reference points commonly used in technical analysis and scalping strategies.
โปรไฟล์อินดิเคเตอร์
รีวิวจากลูกค้า
4.0
รีวิว: 1
5 | 0 % | |
4 | 100 % | |
3 | 0 % | |
2 | 0 % | |
1 | 0 % |
รีวิวจากลูกค้า
October 20, 2025
Clean and visual 🎨 - Daily Open Zones make trend bias crystal clear. Great tool for intraday planning and momentum entries!
การสนทนา
คำถามที่พบบ่อย
Forex
Scalping
EURUSD
Crypto
Grid
XAUUSD
ผลิตภัณฑ์ที่มีให้บริการผ่าน cTrader Store รวมถึงบอทการเทรด อินดิเคเตอร์ และปลั๊กอิน มีให้บริการโดยนักพัฒนาบุคคลที่สามและมีไว้เพื่อวัตถุประสงค์ในการเข้าถึงข้อมูลและทางเทคนิคเท่านั้น cTrader Store ไม่ใช่โบรกเกอร์และไม่ได้ให้คำแนะนำการลงทุน คำแนะนำส่วนบุคคล หรือการรับประกันผลการดำเนินงานในอนาคต


ราคา
ตั้งแต่ 13/09/2025
27
การขาย
5.4K
ติดตั้งฟรี