คำอธิบาย
ดัชนีแรงกดดันสภาพคล่องเป็นเครื่องมือระดับมืออาชีพที่ออกแบบมาเพื่อให้เทรดเดอร์ได้มองลึกลงไปในพลวัตที่ซ่อนอยู่ของสภาพคล่องในตลาด แตกต่างจากออสซิลเลเตอร์แบบดั้งเดิมที่ตอบสนองเฉพาะราคาดัชนีแรงกดดันสภาพคล่องผสมผสานปริมาณทิก การบีบอัดความผันผวน และทิศทางการไหลเข้าไว้ในเส้นเดียวที่อ่านง่าย ซึ่งทำให้เป็นเครื่องมือที่ทรงพลังสำหรับเทรดเดอร์ที่ต้องการเข้าใจว่าความกดดันในการซื้อหรือขายเป็นฝ่ายครองตลาดจริงหรือไม่เบื้องหลังแท่งเทียน
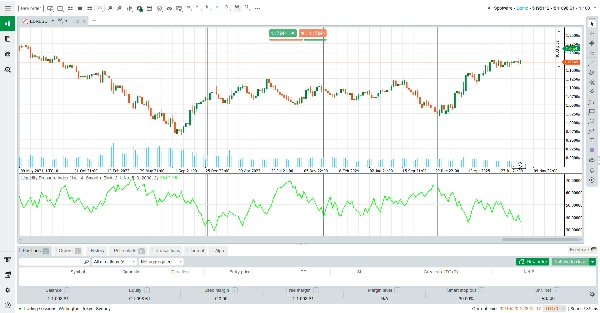
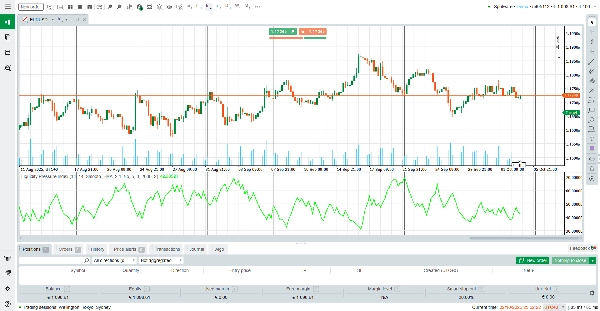
โดยแก่นแท้ ALB คำนวณสมดุลระหว่างสภาพคล่องการซื้อที่สะสมและสภาพคล่องการขายที่สะสม โดยปรับผลลัพธ์ให้เป็นมาตรฐานเทียบกับปริมาณทิกแบบหมุนเวียน ผลลัพธ์จะอยู่รอบระดับเป็นกลางที่ 50 ค่าที่สูงกว่า 50 แสดงถึงสภาพคล่องการซื้อที่แข็งแกร่งกว่า ขณะที่ค่าที่ต่ำกว่า 50 เน้นสภาพคล่องการขายที่แข็งแกร่งกว่า
สัญญาณภาพง่ายๆ นี้ช่วยให้เทรดเดอร์ประเมินการไหลของคำสั่งพื้นฐานได้ทันทีโดยไม่ต้องตีความตัวชี้วัดหลายตัวพร้อมกัน
วิธีอ่านตัวชี้วัด
เส้นเหนือ 50: ตลาดแสดงสภาพคล่องฝั่งซื้อที่แข็งแกร่งกว่า ซึ่งมักสนับสนุนการต่อเนื่องของแนวโน้มขาขึ้นหรือบ่งชี้ความต้องการที่ซ่อนอยู่ซึ่งดูดซับคำสั่งขาย
เส้นต่ำกว่า 50 : ตลาดแสดงสภาพคล่องฝั่งขายที่แข็งแกร่งกว่า ซึ่งมักสนับสนุนการต่อเนื่องของแนวโน้มขาลงหรือบ่งชี้อุปทานที่ซ่อนอยู่ซึ่งดูดซับคำสั่งซื้อ
เส้นราบหรือติดกับ 50: สภาพคล่องสมดุล แสดงถึงความลังเลหรือการรวมตัวของราคา
ตัวเลือกการปรับเรียบ: เทรดเดอร์สามารถเลือกใช้การปรับเรียบแบบ EMA หรือ KAMA เพื่อลดเสียงรบกวนและเน้นแนวโน้มสภาพคล่องที่โดดเด่น
วิธีการทำงาน
ตัวชี้วัดจะวัดความผันผวนของช่วงจริง (ATR) ก่อนและเปรียบเทียบกับช่วงแท่งเทียนจริงเพื่อประเมินการบีบอัด จากนั้นจะรวมกับปริมาณทิกเพื่อแยกสภาพคล่องที่รอดำเนินการ (คำสั่งที่รอในสมุดคำสั่ง) ออกจากสภาพคล่องที่ดำเนินการแล้ว (คำสั่งที่เติมเต็มแล้ว) ขึ้นอยู่กับทิศทางของแท่งเทียน อัลกอริทึมจะจัดสรรการดูดซับการซื้อหรือขายที่ซ่อนอยู่ สุดท้ายผลลัพธ์จะถูกปรับให้เป็นมาตรฐานเทียบกับ EMA แบบหมุนเวียนของปริมาณทิก ปรับขนาด และปรับเรียบเพื่อความชัดเจน
ผลลัพธ์คือดัชนีสภาพคล่องที่มีพลวัตซึ่งปรับตัวตามสภาพตลาดและเผยให้เห็นการต่อสู้ระหว่างผู้ซื้อและผู้ขายแบบเรียลไทม์
คุณสมบัติหลัก
ข้อมูลเชิงลึกที่เน้นสภาพคล่อง: เกินกว่าราคาเพื่อเปิดเผยแรงกดดันซื้อ/ขายที่ซ่อนอยู่
การปรับเรียบแบบปรับตัว: เลือกระหว่าง EMA หรือ KAMA เพื่อลดเสียงรบกวน
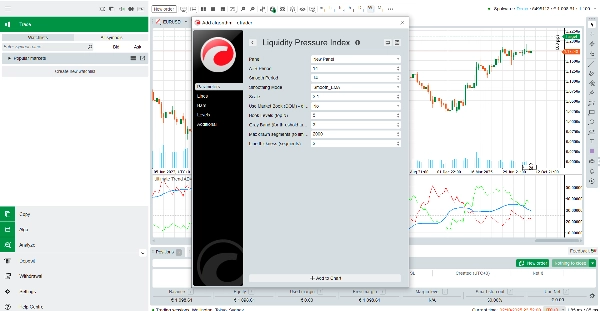
พารามิเตอร์ที่ปรับแต่งได้: ควบคุมช่วง ATR ความยาวการปรับเรียบ ขนาด และความหนาของเส้น
ประสิทธิภาพที่ปรับให้เหมาะสม: การออกแบบน้ำหนักเบาพร้อมขีดจำกัดส่วนเพื่อให้การแสดงผลกราฟราบรื่น
ทำไมต้องใช้ดัชนีแรงกดดันสภาพคล่อง?
ในตลาดที่เคลื่อนไหวรวดเร็ว ราคาเพียงอย่างเดียวอาจทำให้เข้าใจผิด Advanced Liquidity Balance มอบมุมมองที่ลึกซึ้งกว่าให้กับเทรดเดอร์ แสดงให้เห็นว่าตลาดได้รับการสนับสนุนโดยสภาพคล่องจริงหรือไม่ หรือการเคลื่อนไหวเกิดจากการมีส่วนร่วมที่อ่อนแอ ไม่ว่าคุณจะเป็นสแคปเปอร์ที่มองหาความไม่สมดุลระยะสั้นหรือเทรดเดอร์สวิงที่ยืนยันความแข็งแกร่งของแนวโน้ม ดัชนีแรงกดดันสภาพคล่องมอบเลนส์สภาพคล่องระดับมืออาชีพ—และที่ดีที่สุดคือ มันฟรีทั้งหมด
ดาวน์โหลดวันนี้และเพิ่มมิติใหม่ของความชัดเจนให้กับการตัดสินใจเทรดของคุณ
สรุป
รีวิวจากลูกค้า
5 | 0 % | |
4 | 100 % | |
3 | 0 % | |
2 | 0 % | |
1 | 0 % |