
Beschreibung
Ultimate Trend ADX ist eine leistungsstarke und verfeinerte Version des klassischen Average Directional Index (ADX), entwickelt, um Händlern eine klarere, dynamischere Sicht auf Markttrends und Momentum zu bieten. Im Gegensatz zum Standard-ADX verwendet dieses erweiterte Tool fortschrittliche Glättungstechniken (EMA oder KAMA) und führt Skalierungsoptionen ein, um die Indikatorlinien reaktionsfähiger und visuell wirkungsvoller zu machen. Das Ergebnis ist ein professioneller Indikator, der Ihnen hilft, starke Trends zu erkennen, Umkehrungen zu identifizieren und Einstiege mit größerem Vertrauen zu bestätigen.
Wie man den Indikator liest
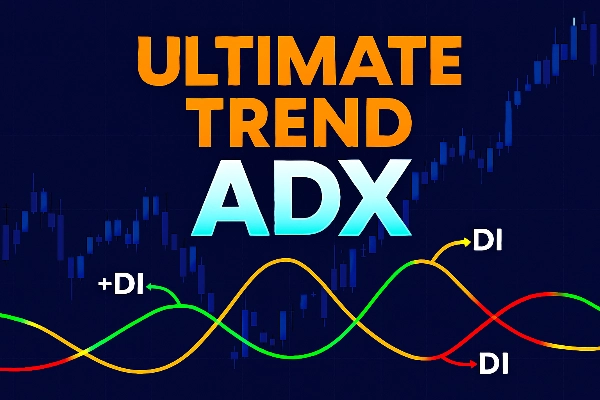
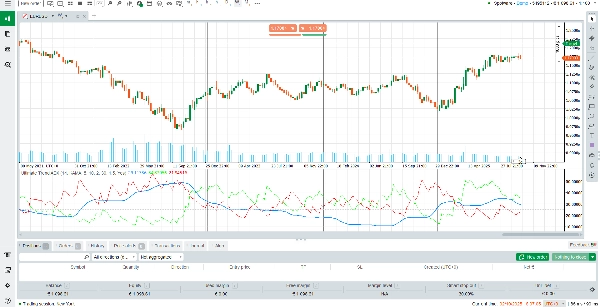
Ultimate Trend ADX zeigt drei Schlüssel-Linien in einem separaten Fenster unter Ihrem Chart an:
ADX-Linie (Blau/Gelb): Misst die Gesamtstärke des Trends. Ein steigender ADX zeigt einen sich verstärkenden Trend an, während ein fallender ADX auf nachlassendes Momentum hinweist. Werte über 25 signalisieren typischerweise einen starken Trend.
+DI-Linie (Grün): Repräsentiert bullische Richtungsbewegungen. Wenn +DI über –DI liegt, haben die Käufer die Kontrolle.
–DI-Linie (Rot): Repräsentiert bärische Richtungsbewegungen. Wenn –DI über +DI liegt, dominieren die Verkäufer den Markt.
Das Lesen der Signale ist einfach:
Wenn +DI über –DI kreuzt und der ADX steigt, deutet dies auf einen starken bullischen Trend hin.
Wenn –DI über +DI kreuzt und der ADX steigt, signalisiert dies einen starken bärischen Trend.
Wenn der ADX unter 20–25 liegt, befindet sich der Markt meist in einer Seitwärtsbewegung oder ohne klare Richtung.
Der Indikator enthält außerdem horizontale Niveaus bei 0, 25, 50, 75 und 100, die Ihnen helfen, die Intensität des Trends schnell einzuschätzen.
Wie der Indikator funktioniert
Der Ultimate Trend ADX basiert auf dem Standard Directional Movement System, wurde jedoch mit modernen Glättungsalgorithmen verbessert:
Exponentieller gleitender Durchschnitt (EMA): Bietet eine schnelle, reaktionsfähige Glättungsoption für Händler, die kurzfristiges Momentum erfassen möchten.
Kaufmans Adaptive Moving Average (KAMA): Passt sich dynamisch an die Marktvolatilität an, filtert Rauschen während Seitwärtsbewegungen heraus und bleibt während starker Trends sensibel.
Skalierungsfaktor für +DI und –DI: Verstärkt die grünen und roten Linien, wodurch bullische und bärische Signale auf dem Chart sichtbarer und leichter interpretierbar werden.
Diese Kombination stellt sicher, dass sich der Indikator an verschiedene Marktumgebungen anpasst und Ihnen sowohl Klarheit als auch Präzision bietet.
Hauptmerkmale
Verbesserte ADX-Berechnung – Verwendet EMA- oder KAMA-Glättung für eine genauere und anpassungsfähigere Messung der Trendstärke.
Klare visuelle Signale – Deutliche Farbgebung (blau/gelb für ADX, grün für +DI, rot für –DI) macht die Interpretation intuitiv.
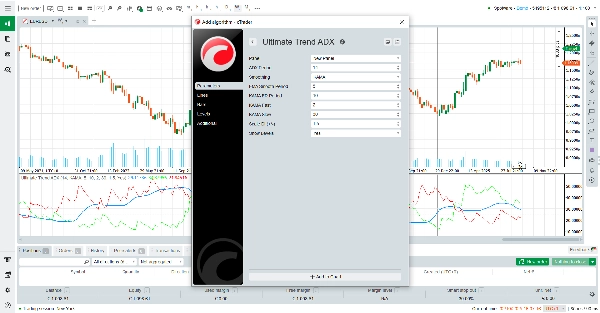
Anpassbare Sensitivität – Parameter ermöglichen es Ihnen, die Reaktionsfähigkeit an Ihren Handelsstil anzupassen.
Eingebaute horizontale Niveaus – Schnellreferenzniveaus (0/25/50/75/100) helfen Ihnen, die Trendintensität sofort einzuschätzen.
Warum Ultimate Trend ADX wählen?
Handelserfolg hängt oft davon ab, zu erkennen, wann ein Markt trendet und wann nicht. Der Ultimate Trend ADX verschafft Ihnen diesen Vorteil, indem er die Zuverlässigkeit des klassischen ADX mit modernen Verbesserungen kombiniert, die ihn schärfer, klarer und handlungsorientierter machen. Egal, ob Sie Forex, Aktien, Indizes oder Rohstoffe handeln, dieser Indikator hilft Ihnen, Rauschen herauszufiltern, Signale zu bestätigen und mit der vorherrschenden Marktrichtung im Einklang zu bleiben.
Zusammenfassung
This indicator incorporates exponential moving average (EMA) or Kaufman’s adaptive moving average (KAMA) smoothing techniques to improve responsiveness and reduce noise. It also features a scaling factor for the +DI and –DI lines, enhancing signal visibility. Horizontal reference levels at 0, 25, 50, 75, and 100 assist in quickly assessing trend intensity.
Ultimate Trend ADX supports multiple markets including forex, stocks, indices, commodities, and cryptocurrencies. It is suitable for various trading strategies such as scalping, breakout, and grid trading. Adjustable sensitivity settings allow customization to fit different trading styles. This tool aids traders in identifying strong trends, spotting reversals, and confirming entry signals with improved clarity and precision.
Kundenbewertungen
5 | 100 % | |
4 | 0 % | |
3 | 0 % | |
2 | 0 % | |
1 | 0 % |


