

Beschreibung
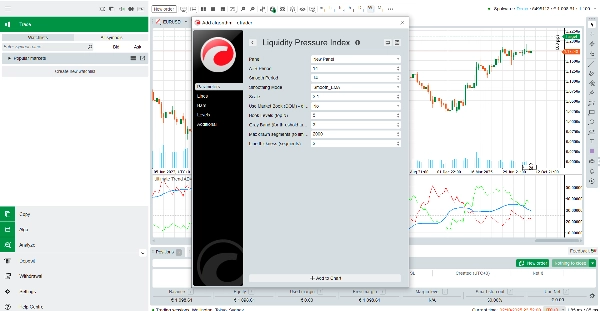
Liquidity Pressure Index ist ein professionelles Werkzeug, das Tradern einen tieferen Einblick in die verborgenen Dynamiken der Marktliquidität bietet. Im Gegensatz zu traditionellen Oszillatoren, die nur auf den Preis reagieren, kombiniert der Liquidity Pressure Index Tick-Volumen, Volatilitätskompression und Richtungsfluss zu einer einzigen, leicht lesbaren Linie. Dies macht ihn zu einem leistungsstarken Begleiter für Trader, die verstehen möchten, ob Kauf- oder Verkaufsdruck hinter den Kerzen wirklich dominiert.
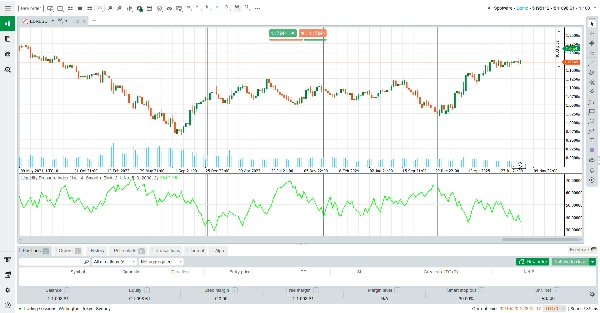
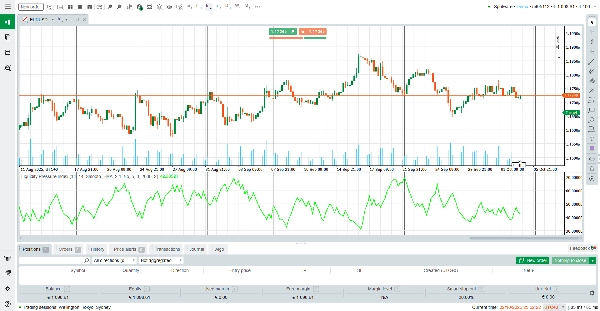
Im Kern berechnet ALB das Gleichgewicht zwischen angesammelter Kaufliquidität und angesammelter Verkaufslquidität und normalisiert das Ergebnis anhand des rollierenden Tick-Volumens. Die Ausgabe ist um das neutrale Niveau von 50 zentriert. Werte über 50 zeigen eine stärkere Kaufliquidität an, während Werte unter 50 eine stärkere Verkaufslquidität hervorheben.
Dieses einfache visuelle Signal ermöglicht es Tradern, den zugrunde liegenden Orderfluss sofort einzuschätzen, ohne mehrere Indikatoren gleichzeitig interpretieren zu müssen.
Wie man den Indikator liest
Linie über 50: Der Markt zeigt eine stärkere Kaufseite-Liquidität. Dies unterstützt oft eine bullische Fortsetzung oder signalisiert eine verborgene Nachfrage, die Verkaufsaufträge absorbiert.
Linie unter 50 : Der Markt zeigt eine stärkere Verkaufsseite-Liquidität. Dies unterstützt oft eine bärische Fortsetzung oder signalisiert ein verborgenes Angebot, das Kaufaufträge absorbiert.
Flach oder nahe 50: Die Liquidität ist ausgeglichen, was auf Unentschlossenheit oder Konsolidierung hindeutet.
Glättungsoptionen: Trader können zwischen EMA- oder KAMA-Glättung wählen, um Rauschen zu reduzieren und sich auf den dominanten Liquiditätstrend zu konzentrieren.
Wie es funktioniert
Der Indikator misst zunächst die True Range Volatilität (ATR) und vergleicht sie mit der tatsächlichen Kerzenreichweite, um die Kompression zu schätzen. Anschließend kombiniert er dies mit dem Tick-Volumen, um ausstehende Liquidität (Aufträge, die im Orderbuch warten) von ausgeführter Liquidität (bereits erfüllte Aufträge) zu trennen. Je nach Kerzenrichtung weist der Algorithmus eine verborgene Kauf- oder Verkaufsabsorption zu. Schließlich wird das Ergebnis gegen einen rollierenden EMA des Tick-Volumens normalisiert, skaliert und zur besseren Übersicht geglättet.
Das Ergebnis ist ein dynamischer Liquiditätsindex, der sich an die Marktbedingungen anpasst und in Echtzeit das Tauziehen zwischen Käufern und Verkäufern offenbart.
Hauptmerkmale
Liquiditätsfokussierte Einsicht: Geht über den Preis hinaus, um verborgenen Kauf-/Verkaufsdruck zu offenbaren.
Adaptive Glättung: Wahl zwischen EMA oder KAMA zur Rauschreduzierung.
Anpassbare Parameter: Steuerung der ATR-Periode, Glättungslänge, Skalierung und Linienstärke.
Optimierte Leistung: Leichtgewichtiges Design mit Segmentgrenzen für eine flüssige Darstellung.
Warum den Liquidity Pressure Index verwenden?
In schnelllebigen Märkten kann der Preis allein irreführend sein. Der Advanced Liquidity Balance stattet Trader mit einer tieferen Perspektive aus, indem er zeigt, ob der Markt wirklich von Liquidität getragen wird oder ob Bewegungen bei schwacher Beteiligung stattfinden. Ob Sie ein Scalper sind, der kurzfristige Ungleichgewichte sucht, oder ein Swing-Trader, der die Trendstärke bestätigt – der Liquidity Pressure Index bietet eine professionelle Liquiditätsbrille – und das Beste daran ist, dass er völlig kostenlos ist.
Laden Sie ihn noch heute herunter und fügen Sie Ihren Handelsentscheidungen eine neue Dimension der Klarheit hinzu.
Zusammenfassung
Kundenbewertungen
5 | 0 % | |
4 | 100 % | |
3 | 0 % | |
2 | 0 % | |
1 | 0 % |


