
Beschreibung
Klassisches proportionales CVD (Verankert)
Entdecken Sie die wahre Absicht der Marktteilnehmer mit dem klassischen proportionalen CVD. Im Gegensatz zu Standardindikatoren für kumulative Volumendifferenzen, die einfach das Tickvolumen aufsummieren, verwendet dieses Tool eine proportionale Logik, um das Volumen basierend auf der tatsächlichen Kursbewegung innerhalb jeder Kerze zu gewichten.
Warum "proportionale" Delta?
Standard-CVD kann irreführend sein. Dieser Indikator berechnet das Delta, indem er die Beziehung zwischen der Kerzen-Spanne (Hoch-Tief) und der Distanz zwischen Schluss- und Eröffnungskurs analysiert. Dies stellt sicher, dass das Volumen realistisch verteilt wird:
- Kerzen mit starker Überzeugung (Schlusskurs nahe Hoch/Tief) tragen mehr zum Delta bei.
- Kerzen mit langen Dochten (Anzeichen von Absorption oder Ablehnung) neutralisieren das Delta und verhindern „falsche“ Volumensignale.
Hauptmerkmale
- ⚓ Intelligente Verankerung (Multi-Timeframe-Reset): Halten Sie Ihre Analyse relevant für die aktuelle Handelssitzung. Wählen Sie, ob die Berechnung täglich, wöchentlich oder monatlich zurückgesetzt werden soll – oder lassen Sie sie unbegrenzt laufen.
- 📊 Doppelte Visualisierung:
-
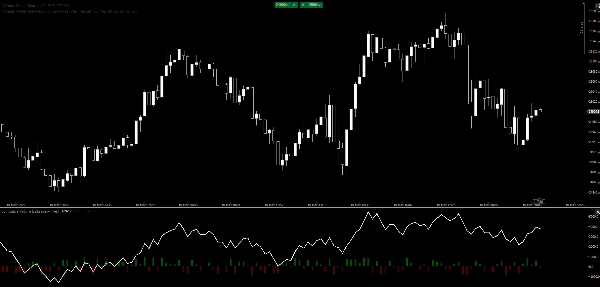
- Die CVD-Linie: Eine klare, leistungsstarke Linie zur Erkennung von langfristigen Divergenzen und Trenderschöpfung.
- Histogramm-Overlay: Sofortiges visuelles Feedback zum Kauf-/Verkaufsdruck pro Kerze, um Höhepunkte oder Absorption auf einen Blick zu erkennen.
- ⚡ Ultra-leichtgewichtig: Geschrieben mit nativer C#-Optimierung für cTrader, was selbst auf schwächeren Rechnern oder volatilen Märkten eine verzögerungsfreie Nutzung gewährleistet.
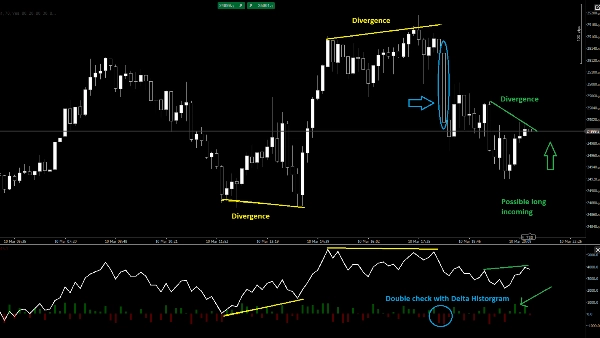
- 🎯 Divergenzerkennung: Erkennen Sie leicht, wenn der Preis neue Hochs erreicht, während das CVD versagt – ein klassisches Zeichen institutioneller Verteilung.
Wie man damit handelt
- Trendbestätigung: Achten Sie darauf, dass die CVD-Linie in dieselbe Richtung wie der Preis tendiert.
- Absorption: Wenn der Preis ein neues Tief erreicht, das CVD-Histogramm jedoch starken „Delta Up“ (Grün) zeigt, absorbieren Käufer den Verkaufsdruck.
- Erschöpfung: Achten Sie auf einen starken Ausschlag im Histogramm (Höhepunkt), gefolgt von einer Umkehr der CVD-Linie.
Parameter:
- Verankerungsmodus: Nie, täglich, wöchentlich, monatlich.
- Bar-Delta anzeigen: Schalten Sie das Histogramm ein/aus.
Entdecken Sie die wahre Absicht der Marktteilnehmer mit dem klassischen proportionalen CVD. Im Gegensatz zu Standardindikatoren für kumulative Volumendifferenzen, die einfach das Tickvolumen aufsummieren, verwendet dieses Tool eine proportionale Logik, um das Volumen basierend auf der tatsächlichen Kursbewegung innerhalb jeder Kerze zu gewichten.
Warum "proportionale" Delta?
Standard-CVD kann irreführend sein. Dieser Indikator berechnet das Delta, indem er die Beziehung zwischen der Kerzen-Spanne (Hoch-Tief) und der Distanz zwischen Schluss- und Eröffnungskurs analysiert. Dies stellt sicher, dass das Volumen realistisch verteilt wird:
- Kerzen mit starker Überzeugung (Schlusskurs nahe Hoch/Tief) tragen mehr zum Delta bei.
- Kerzen mit langen Dochten (Anzeichen von Absorption oder Ablehnung) neutralisieren das Delta und verhindern „falsche“ Volumensignale.
Hauptmerkmale
- ⚓ Intelligente Verankerung (Multi-Timeframe-Reset): Halten Sie Ihre Analyse relevant für die aktuelle Handelssitzung. Wählen Sie, ob die Berechnung täglich, wöchentlich oder monatlich zurückgesetzt werden soll – oder lassen Sie sie unbegrenzt laufen.
- 📊 Doppelte Visualisierung:
-
- Die CVD-Linie: Eine klare, leistungsstarke Linie zur Erkennung von langfristigen Divergenzen und Trenderschöpfung.
- Histogramm-Overlay: Sofortiges visuelles Feedback zum Kauf-/Verkaufsdruck pro Kerze, um Höhepunkte oder Absorption auf einen Blick zu erkennen.
- ⚡ Ultra-leichtgewichtig: Geschrieben mit nativer C#-Optimierung für cTrader, was selbst auf schwächeren Rechnern oder volatilen Märkten eine verzögerungsfreie Nutzung gewährleistet.
- 🎯 Divergenzerkennung: Erkennen Sie leicht, wenn der Preis neue Hochs erreicht, während das CVD versagt – ein klassisches Zeichen institutioneller Verteilung.
Wie man damit handelt
- Trendbestätigung: Achten Sie darauf, dass die CVD-Linie in dieselbe Richtung wie der Preis tendiert.
- Absorption: Wenn der Preis ein neues Tief erreicht, das CVD-Histogramm jedoch starken „Delta Up“ (Grün) zeigt, absorbieren Käufer den Verkaufsdruck.
- Erschöpfung: Achten Sie auf einen starken Ausschlag im Histogramm (Höhepunkt), gefolgt von einer Umkehr der CVD-Linie.
Parameter:
- Verankerungsmodus: Nie, täglich, wöchentlich, monatlich.
- Bar-Delta anzeigen: Schalten Sie das Histogramm ein/aus.
Zusammenfassung
Key features include smart anchoring with multi-timeframe resets (daily, weekly, monthly, or continuous), dual visuals comprising a CVD line for spotting divergences and trend exhaustion, and a histogram overlay for immediate per-bar buying or selling pressure insights. The indicator is optimized in native C# for cTrader, ensuring high performance and low resource use.
Traders can use the indicator for trend confirmation by aligning CVD direction with price, identify absorption when price lows coincide with strong positive delta in the histogram, and detect exhaustion through histogram spikes followed by CVD reversals. Adjustable parameters include anchor mode and histogram display toggle.
This tool supports analysis across multiple markets and symbols, including Forex, cryptocurrencies, indices, commodities, and stocks.
Kundenbewertungen
5 | 0 % | |
4 | 100 % | |
3 | 0 % | |
2 | 0 % | |
1 | 0 % |


