

Açıklama
Anormal Hacim Kümeleri cTrader için tasarlanmış, kurumsal izleri ve aşırı işlem aktivitesini ortaya çıkarmaya yönelik yüksek hassasiyetli bir hacim analiz aracıdır. Hacim, fiyatın öncüsüdür ve bu gösterge size "akıllı paranın" piyasaya tam olarak nereden girdiğini gösterir.
Sabit, statik hacim eşiklerine güvenmek yerine, bu gösterge dinamik kayan yüzde mantığı kullanır. Son geçmişi analiz eder ve sadece hacmi gerçekten anormal olan mumları vurgular (örneğin, son 200 periyot içindeki en yüksek %5 hacimli çubuklar).
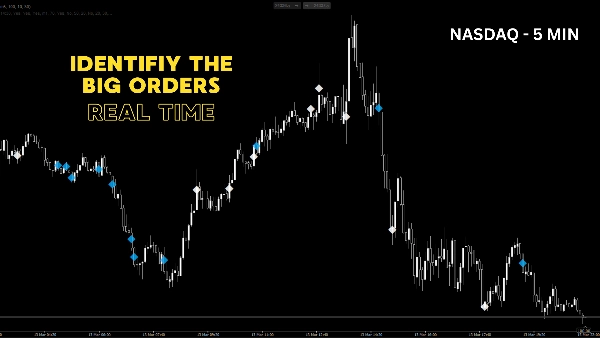
Büyük bir avantajı ise Çoklu Zaman Dilimi (MTF) yeteneğidir: 5 dakikalık grafikte işlem yaparken, gösterge sessizce daha yüksek bir "Temel Periyot"u (örneğin 1 Saatlik grafik) hacim sıçramaları için izler ve bu kritik kümeleri tam olarak gerçekleştiği yerde alt zaman dilimi grafiğinize yansıtır.
🔥 Temel Özellikler:
- Dinamik Hassasiyet: Kayan yüzde eşiği kullanır (örneğin %95) böylece hem sakin hem de çok volatil piyasa koşullarına otomatik olarak uyum sağlar.
- Gerçek Çoklu Zaman Dilimi: Daha yüksek temel zaman dilimi kullanarak piyasa gürültüsünü filtrelerken, alt zaman dilimlerinde girişlerinizi tam isabetle yapmanızı sağlar.
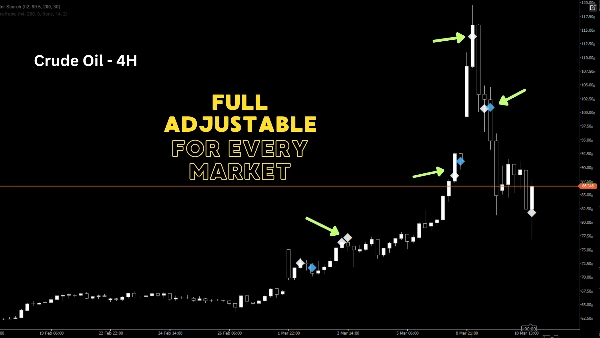
- Yönlü Kümeler: Aşırı hacim olayları, medyan fiyatın tam üzerinde elmas işaretleri (◆) olarak çizilir. Boğa kapanışları için yeşil, ayı kapanışları için kırmızı.
- Yüksek Optimizasyon: Yerleşik bellek yönetimi (maksimum 2000 çizilmiş nesne) cTrader platformunuzun ışık hızında kalmasını sağlar.
- Tam Özelleştirilebilir: Geriye dönük dönem, hassasiyet (%), temel zaman dilimi, küme boyutu ve renkleri kişisel işlem tarzınıza uyacak şekilde ayarlayın.
💡 Nasıl kullanılır?
Anormal hacim genellikle iki şeyden birini gösterir: Büyük trend başlangıcı (kırılmalar) veya teslimiyet/emilim (dönüşler). Bu kümeleri tespit ederek, sadece fiyat hareketine değil, gerçek işlem gören sermayeye dayalı gizli destek ve direnç bölgelerini belirleyebilirsiniz. Gerçek bir avantaj arayan Günlük Traderlar, Scalperlar, Swing Traderlar ve Hacim İşlemcileri için mükemmeldir.
Özet
Müşteri değerlendirmeleri
5 | 0 % | |
4 | 67 % | |
3 | 33 % | |
2 | 0 % | |
1 | 0 % |


