
Açıklama
Klasik Oransal CVD (Çapa)
Piyasa katılımcılarının gerçek niyetini Klasik Oransal CVD ile ortaya çıkarın. Sadece tick hacmini toplayan standart Kümülatif Hacim Delta göstergelerinin aksine, bu araç her bar içindeki gerçek fiyat hareketine dayalı olarak hacmi ağırlıklandırmak için Oransal Mantık kullanır.
Neden "Oransal" Delta?
Standart CVD yanıltıcı olabilir. Bu gösterge, Delta'yı Bar Aralığı (Yüksek-Düşük) ile Kapanış-Açılış mesafesi arasındaki ilişkiyi analiz ederek hesaplar. Bu, hacmin gerçekçi şekilde dağıtılmasını sağlar:
- Güçlü kararlılık mumları (yüksek/düşük yakınında kapanan) Delta'ya daha fazla katkıda bulunur.
- Fitil ağırlıklı mumlar (absorpsiyon veya reddetme işaretleri) Delta'yı nötralize eder, "sahte" hacim sinyallerini engeller.
Temel Özellikler
- ⚓ Akıllı Çapalama (Çoklu Zaman Dilimi Sıfırlama): Analizinizi mevcut işlem seansına uygun tutun. Hesaplamayı Günlük, Haftalık veya Aylık olarak sıfırlamayı seçin—ya da sonsuza kadar çalışmaya devam ettirin.
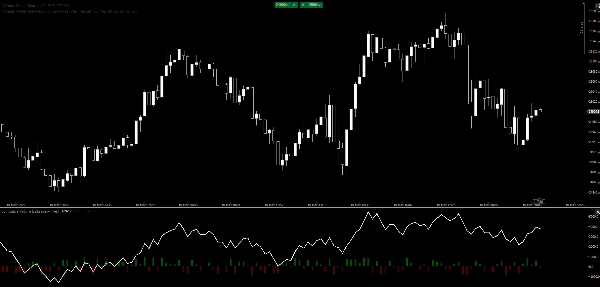
- 📊 Çift Görselleştirme:
-
- CVD Çizgisi: Uzun vadeli uyumsuzlukları ve trend tükenişini tespit etmek için temiz, yüksek performanslı bir çizgi.
- Histogram Üstü: Bar başına alım/satım baskısı hakkında anlık görsel geri bildirim, doruk veya absorpsiyonu hızlıca tanımlamak için.
- ⚡ Ultra Hafif: cTrader için yerel C# optimizasyonu ile yazılmıştır, düşük donanımlı makinelerde veya volatil piyasalarda bile gecikme olmadan çalışır.
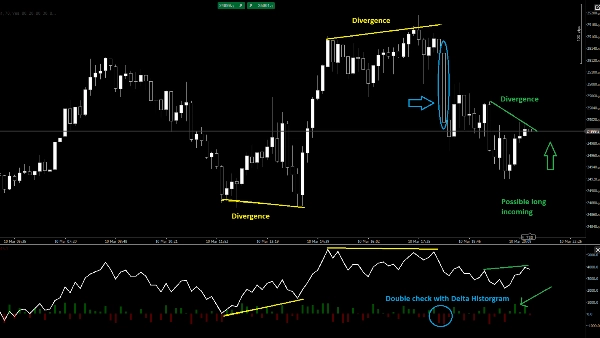
- 🎯 Uyumsuzluk Tespiti: Fiyat yeni zirveler yaparken CVD başarısız olduğunda kolayca tanımlayın—kurumsal dağıtımın klasik işareti.
Nasıl İşlem Yapılır
- Trend Onayı: CVD çizgisinin fiyatla aynı yönde trend yapmasını bekleyin.
- Absorpsiyon: Fiyat yeni bir dip yaptığında ancak CVD Histogramı güçlü "Delta Yukarı" (Yeşil) gösterdiğinde, alıcılar satış baskısını absorbe ediyor demektir.
- Tükenme: Histogramda keskin bir sıçrama (Doruk) ve ardından CVD çizgisinde dönüşü izleyin.
Parametreler:
- Çapa Modu: Asla, Günlük, Haftalık, Aylık.
- Bar Delta Gösterimi: Histogramı açıp kapatın.
Piyasa katılımcılarının gerçek niyetini Klasik Oransal CVD ile ortaya çıkarın. Sadece tick hacmini toplayan standart Kümülatif Hacim Delta göstergelerinin aksine, bu araç her bar içindeki gerçek fiyat hareketine dayalı olarak hacmi ağırlıklandırmak için Oransal Mantık kullanır.
Neden "Oransal" Delta?
Standart CVD yanıltıcı olabilir. Bu gösterge, Delta'yı Bar Aralığı (Yüksek-Düşük) ile Kapanış-Açılış mesafesi arasındaki ilişkiyi analiz ederek hesaplar. Bu, hacmin gerçekçi şekilde dağıtılmasını sağlar:
- Güçlü kararlılık mumları (yüksek/düşük yakınında kapanan) Delta'ya daha fazla katkıda bulunur.
- Fitil ağırlıklı mumlar (absorpsiyon veya reddetme işaretleri) Delta'yı nötralize eder, "sahte" hacim sinyallerini engeller.
Temel Özellikler
- ⚓ Akıllı Çapalama (Çoklu Zaman Dilimi Sıfırlama): Analizinizi mevcut işlem seansına uygun tutun. Hesaplamayı Günlük, Haftalık veya Aylık olarak sıfırlamayı seçin—ya da sonsuza kadar çalışmaya devam ettirin.
- 📊 Çift Görselleştirme:
-
- CVD Çizgisi: Uzun vadeli uyumsuzlukları ve trend tükenişini tespit etmek için temiz, yüksek performanslı bir çizgi.
- Histogram Üstü: Bar başına alım/satım baskısı hakkında anlık görsel geri bildirim, doruk veya absorpsiyonu hızlıca tanımlamak için.
- ⚡ Ultra Hafif: cTrader için yerel C# optimizasyonu ile yazılmıştır, düşük donanımlı makinelerde veya volatil piyasalarda bile gecikme olmadan çalışır.
- 🎯 Uyumsuzluk Tespiti: Fiyat yeni zirveler yaparken CVD başarısız olduğunda kolayca tanımlayın—kurumsal dağıtımın klasik işareti.
Nasıl İşlem Yapılır
- Trend Onayı: CVD çizgisinin fiyatla aynı yönde trend yapmasını bekleyin.
- Absorpsiyon: Fiyat yeni bir dip yaptığında ancak CVD Histogramı güçlü "Delta Yukarı" (Yeşil) gösterdiğinde, alıcılar satış baskısını absorbe ediyor demektir.
- Tükenme: Histogramda keskin bir sıçrama (Doruk) ve ardından CVD çizgisinde dönüşü izleyin.
Parametreler:
- Çapa Modu: Asla, Günlük, Haftalık, Aylık.
- Bar Delta Gösterimi: Histogramı açıp kapatın.
Özet
Key features include smart anchoring with multi-timeframe resets (daily, weekly, monthly, or continuous), dual visuals comprising a CVD line for spotting divergences and trend exhaustion, and a histogram overlay for immediate per-bar buying or selling pressure insights. The indicator is optimized in native C# for cTrader, ensuring high performance and low resource use.
Traders can use the indicator for trend confirmation by aligning CVD direction with price, identify absorption when price lows coincide with strong positive delta in the histogram, and detect exhaustion through histogram spikes followed by CVD reversals. Adjustable parameters include anchor mode and histogram display toggle.
This tool supports analysis across multiple markets and symbols, including Forex, cryptocurrencies, indices, commodities, and stocks.
Müşteri değerlendirmeleri
5 | 0 % | |
4 | 100 % | |
3 | 0 % | |
2 | 0 % | |
1 | 0 % |


