present
Kaydolun ve ilk alışverişinizde $50 indirim kazanın
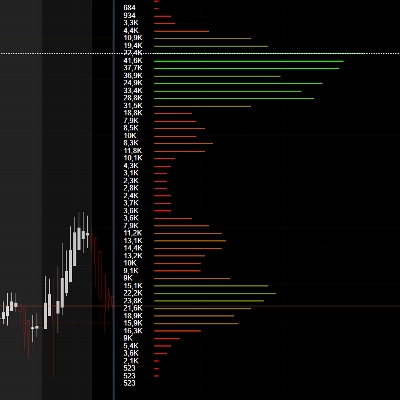
Trading product for Volume Profile Pro v1.0 Gösterge Premium/Discount  Key Levels, image 1
Volume Profile Pro v1.0
Gösterge
5 satın almalar
Sürüm 2.0, Oct 2026
Windows, Mac
4.3
Değerlendirmeler: 3
Trading product for Volume Profile Pro v1.0 Gösterge Premium/Discount  Key Levels, image 2
Trading product for Volume Profile Pro v1.0 Gösterge Premium/Discount  Key Levels, image 3
Trading product for Volume Profile Pro v1.0 Gösterge Premium/Discount  Key Levels, image 4
Trading product for Volume Profile Pro v1.0 Gösterge Premium/Discount  Key Levels, image 5
Trading product for Volume Profile Pro v1.0 Gösterge Premium/Discount  Key Levels, image 6
Trading product for Volume Profile Pro v1.0 Gösterge Premium/Discount  Key Levels, image 7
Trading product for Volume Profile Pro v1.0 Gösterge Premium/Discount  Key Levels, image 8
Trading product for Volume Profile Pro v1.0 Gösterge Premium/Discount  Key Levels, image 9
Trading product for Volume Profile Pro v1.0 Gösterge Premium/Discount  Key Levels, image 10
Trading product for Volume Profile Pro v1.0 Gösterge Premium/Discount  Key Levels, image 11
Başlangıç 18/01/2026
19
Satışlar

Açıklama

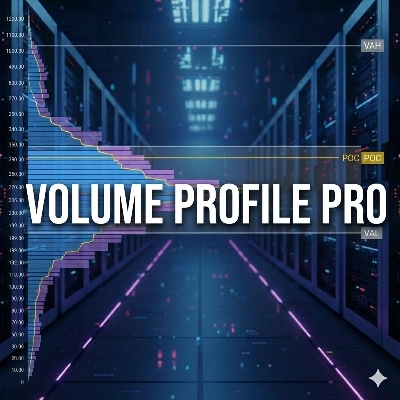
Yeni Volume Profile Pro v2, cTrader için son derece özelleştirilebilir ve hafif bir yan & aralık Hacim Profili göstergesidir; Kontrol Noktası (POC), Değer Alanı Yüksek (VAH) ve Değer Alanı Düşük (VAL) dahil olmak üzere birçok ayarı tercihinize göre ayarlayabilirsiniz.


Ne Yapar

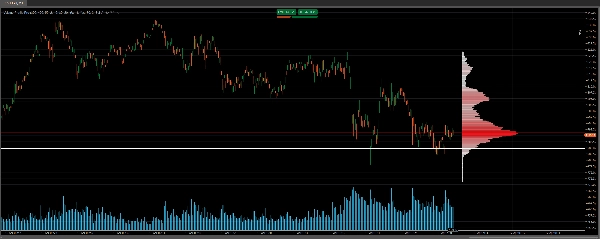
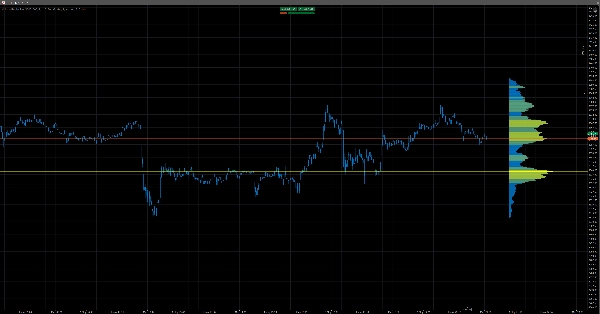
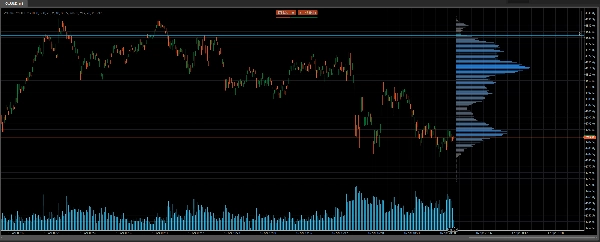
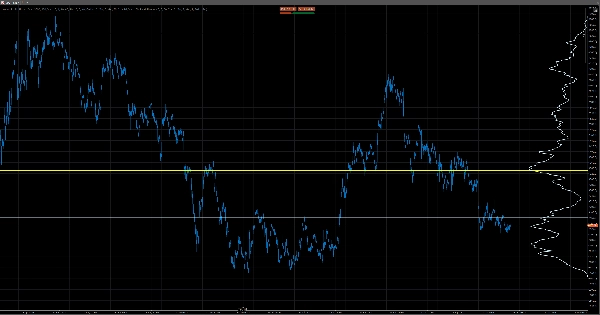
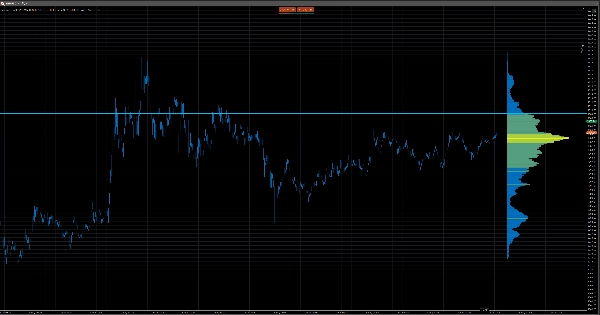
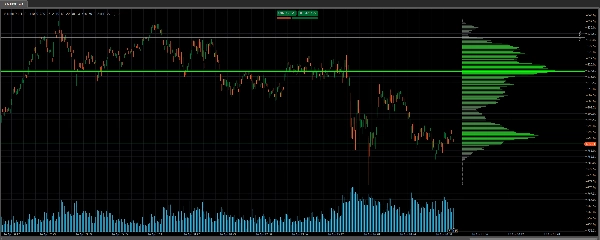
Volume Profile Pro, cTrader grafiğinizin sağ tarafında yatay dinamik bir histogram çizer ve yapılandırılabilir bir geriye dönük pencere boyunca her fiyat seviyesinde ne kadar hacim işlem gördüğünü gösterir. Hacmi zaman üzerinden ölçmek yerine, fiyata göre ölçer — piyasada en çok işlemin yapıldığı yerleri anında ortaya çıkarır. Bundan, otomatik olarak üç ana seviyeyi hesaplar ve çizer: Kontrol Noktası (POC), en yüksek işlem hacmine sahip fiyat; ve Değer Alanı Yüksek (VAH) ile Değer Alanı Düşük (VAL), tüm işlem hacminin %70'ini içeren fiyat aralığının sınırlarıdır (ayar yapılabilir).


Nasıl Çalışır

Gösterge, kullanıcı tarafından tanımlanan sayıda geçmiş barı tarar, yüksekten düşüğe fiyat aralığını bulur ve bunu eşit aralıklı fiyat satırlarına böler. Her barın tick hacmi, kapsadığı her fiyat satırına dağıtılır. Sonuç, hacme orantılı özelleştirilebilir çubuk genişliklerine ve düşükten yükseğe hacim satırlarına kayan bir gradyan renk şemasına sahip fiyat başına hacim histogramıdır. Tamamen standart bar seviyesi OHLCV verileri üzerinde çalışır — tick beslemesi, DOM veya harici veri kaynağı gerekmez — ve yalnızca son bar üzerinde yeniden hesaplama yapar, böylece hızlı, hafif ve kesintisiz kalır.


Son Derece Özelleştirilebilir

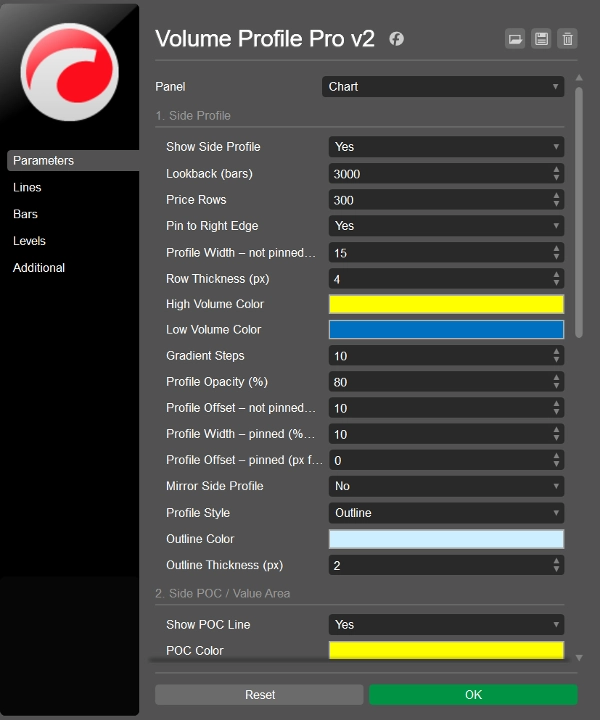
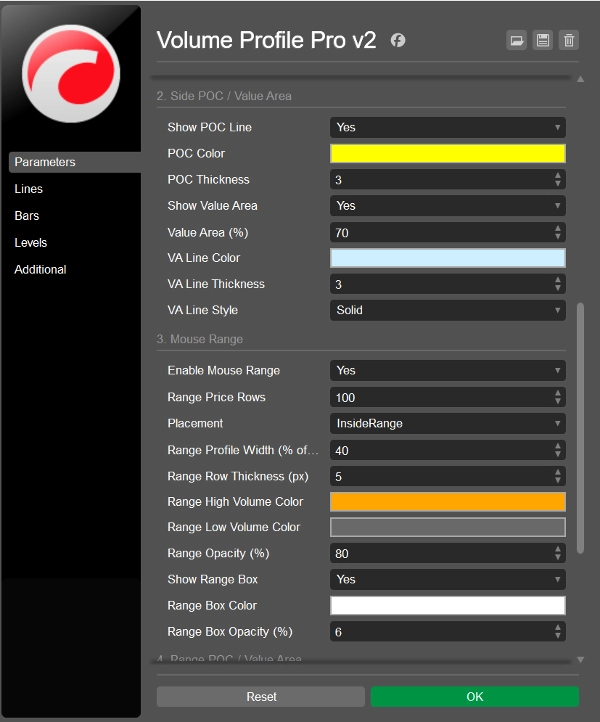
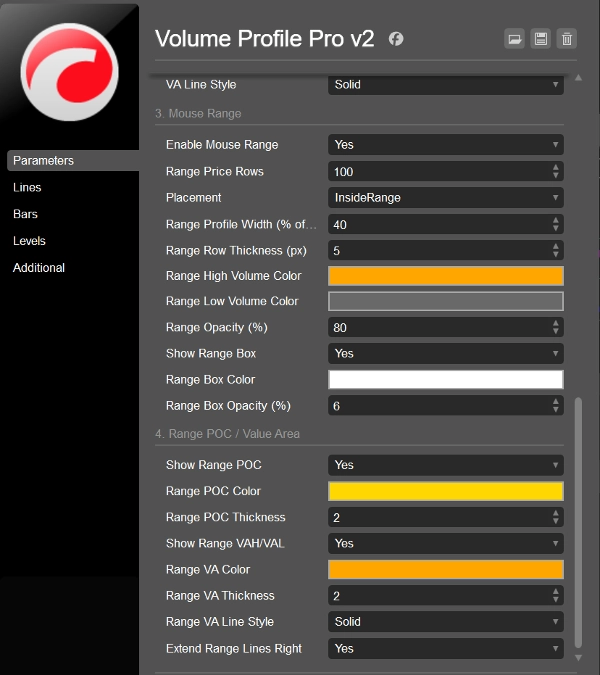
Volume Profile Pro v2 ile neredeyse her görsel ve analitik öğe ayarlanabilir:

  • Yan profilin geriye dönük dönemi
  • Fiyat satırı sayısı ve satır kalınlığı
  • Profil genişliği
  • Opaklık
  • Gradyan renk şeması
  • Yan profili çevirebilirsiniz
  • Yan profili grafiğin sağ tarafına sabitleyebilirsiniz
  • Yan profili çubuklar yerine tek bir çizgi olarak gösterme seçeneğiniz vardır
  • POC rengi ve kalınlığı
  • Değer Alanı yüzde eşiği
  • Değer Alanı çizgi stili.
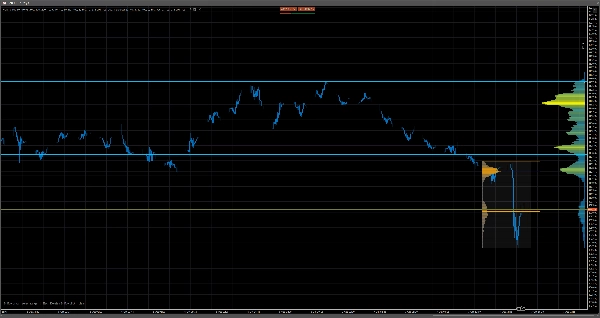
  • Ayrıca seçilen bir aralıkta aralık profili gösterebilirsiniz. Sadece işaretleyiciyi seçin, işaretleyiciyi sürükleyin + aralığı seçmek için shift tuşuna basılı tutun ve aralık profilini kaldırmak için Esc tuşuna iki kez basın.

Bu, onu hem ince bir arka plan referans katmanı hem de cesur bir bağımsız analitik araç olarak eşit derecede kullanılabilir kılar.


Kimler İçin

  • Hafif bir yan & aralık Hacim Profili göstergesi isteyen traderlar
  • Hacim profilini katı bir çizgi olarak bile gösterebileceğiniz temiz görünümlü bir Hacim Profili isteyen traderlar
  • Geriye dönük dönemi grafikte kendisi ayarlamak isteyen traderlar
  • Birçok renk ve opaklık ayarlama yeteneğine sahip olmak isteyen traderlar
  • Genişliği ve grafikteki yerleşimini ayarlamak veya yan tarafa sabitlemek isteyen traderlar
  • Fiyat satırı sayısını ayarlamak isteyen traderlar (400'ün altında tutmak önerilir)
  • Kontrol Noktası (POC), Değer Alanı Yüksek (VAH) ve Değer Alanı Düşük (VAL) çizgilerini açıp kapatmak ve görünümünü ayarlamak isteyen traderlar


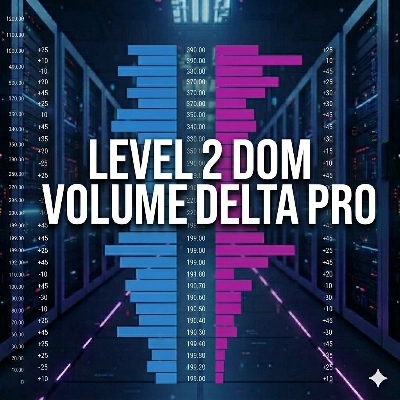
Anahtar seviyelerde daha iyi bilgilendirilmiş kararlar için Level 2 DOM Volume Delta Pro göstergemizle birleştirin: https://ctrader.com/products/4138


Muhteşem Black Box Bot’umuzu burada görün: https://ctrader.com/products/3241


Özet

AI summary
Volume Profile Pro is a customizable volume profile indicator designed for cTrader. It displays a horizontal histogram on the chart representing traded volume by price level over a user-defined lookback period. The indicator identifies and plots three key levels: Point of Control (POC)—the price with the highest traded volume, Value Area High (VAH), and Value Area Low (VAL), which define the price range containing a configurable percentage (default 70%) of total volume.

The tool analyzes historical bar data by dividing the high-to-low price range into evenly spaced rows and distributing each bar’s tick volume across these rows. This creates a volume-at-price histogram with adjustable bar widths proportional to volume and a gradient color scheme indicating volume intensity. It operates solely on standard OHLCV bar data without requiring tick feeds or external sources, recalculating only on the latest bar to maintain performance.

Users can extensively customize visual and analytical settings, including lookback period, number of price rows, profile width, opacity, colors, and the appearance and visibility of POC, VAH, and VAL lines. This flexibility allows the indicator to serve as either a subtle background reference or a prominent analytical tool. It supports analysis of key market structure concepts such as supply and demand, support and resistance, and liquidity zones.
Gösterge profili
Gösterge kategorisi
Hacim
Çıktı türü
Görselleştirme
Veri gereklilikleri
Hacim
Tick verisi
PD
Yalnızca çubuklar
Desteklenen sinyaller
Kırılma
Yön değiştirme
Seviye kırılması
Seviyeye dokunuş
Volatilite

Müşteri değerlendirmeleri

4.3
Değerlendirmeler: 3
5
33 %
4
67 %
3
0 %
2
0 %
1
0 %
Müşteri değerlendirmeleri
May 1, 2026
Fine for a side read, especially when the chart is not clean.
April 27, 2026
it works as a side layer because it supports the plan without acting like the plan, and 2 sessions is the line to watch.
April 22, 2026
not bad if the rules are already clear. 30 days gives the idea room.

Tartışma

SSS

Premium/Discount
Key Levels
Volume
Market Structure
Supply & Demand
Liquidity Grab
Support & Resistance
cTrader Store üzerinden erişilebilen işlem botları, göstergeler ve eklentiler gibi ürünler, üçüncü taraf sağlayıcılar tarafından sağlanır ve yalnızca bilgilendirme ve teknik erişim amaçlarıyla sunulur. cTrader Store bir broker değildir ve yatırım tavsiyesi, kişisel öneriler vermez veya gelecekteki performansı garanti etmez.

Bu oluşturanın diğer ürünleri

Gösterge
BOS
Volume
+5
The Volume Delta Indicator using Institutional Level 2 DOM Data, The Edge Institutions Pay Millions For, now on cTrader
cBot
Volume
XAUUSD
+5
The Black Box Bot v2 is out. A New Revolution. Make up to 750% per year on Gold m5.
Gösterge
VWAP
Volume
+5
Multi VWAP. Three timeframes. One clean chart. Your Essential Trading Tool.

Şunları da beğenebilirsiniz

Gösterge
ATR
Forex
+6
UT Bot Alerts Nova: Advanced trend-following indicator using ATR for signals. Precise entries/exits.
Gösterge
AI
ATR
+27
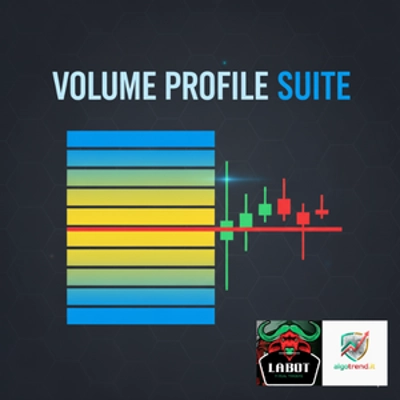
VolumeProfileSuite is an advanced and flexible Volume Profile indicator for cTrader.
Gösterge
BOS
Add standard-timeframe context candles to a native Renko chart.
Gösterge
BOS
MSS
+4
See confirmed BOS, CHOCH and SWEEP structure events on your cTrader chart.
Gösterge
AI
ATR
+19
Market Cipher A
Gösterge
Boost your trading with Candlestick Patterns for cTrader – auto-detect key signals for smarter, faster decisions!
Gösterge
Doji
Volume
+5
Instantly spot high-liquidity institutional moves with clean, non-obtrusive triangle alerts on cTrader charts.
Gösterge
SMC
Forex
+5
Pinpoint FVGs, track fills and see mitigation stats — trade imbalances with clarity and confidence.
Gösterge
Volume
Key Levels
View tick activity across a selected chart range with Point of Control, Value Area High and Value Area Low.
Gösterge
ATR
Forex
+9
Auto-detect swing highs/lows. Spot reversals, map structure, and filter noise with adjustable strength.
Gösterge
RSI
Signal
+2
Identifies trends with moving averages & volatility. Base levels = bullish 🐂 or bearish 🐻 signals. Reversals detected!
"RSI Advanced" logosu
En yüksek puanlı
5.0
(4)
$20
/
$30
Gösterge
AI
ATR
+12
The standard Relative Strength Index (RSI), RSI & Signal Cloud, Smart Volatility Filter (ATR), On-Chart Info Dashboard
Gösterge
Forex
NAS100
+3
volumen perfile
Gösterge
MACD
Prop
+14
Enhance MACD Histogram! Visualize bull and bear price changes with vibrant colors for clearer, more insightful trading.
Gösterge
ATR
SMC
+17
Adaptive Swing-Anchored VWAP that tracks market structure shifts with precision and clarity.
Gösterge
RSI
Forex
+4
New version of one of my favorites includes Fibonacci and moving average convergence divergence lines
Gösterge
AI
ATR
+27
Supertrend Indicator
Gösterge
Imbalance
Fair Value Gap
+1
Multi-symbol, multi-timeframe Fair Value Gaps in one panel.

Fiyat

Başlangıç 18/01/2026
19
Satışlar