
ADXMultiframeIndicator
Gösterge
1 satın almalar
Sürüm 1.0, Oct 2025
Windows, Mac
5.0
Değerlendirmeler: 2
Açıklama
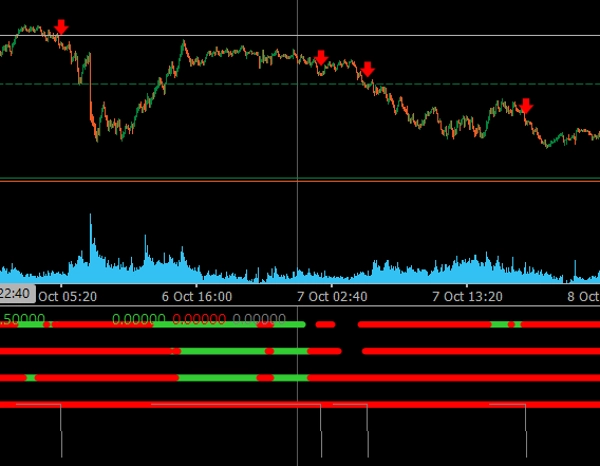
The Multi-Timeframe ADX Trend Dots & Arrows, çoklu zaman dilimlerinde hizalanmış piyasa trendlerini Average Directional Movement Index (ADX) kullanarak tanımlamak için tasarlanmış profesyonel bir cTrader ticaret göstergesidir.
🔹 Temel Özellikler:
- ✅ 4 özelleştirilebilir zaman dilimini (M15, H1, H4, Günlük) analiz edin.
- ✅ Renkli noktalar yönsel eğilimi gösterir (Yeşil = Yükseliş Trend, Kırmızı = Düşüş Trend).
- ✅ Tüm zaman dilimleri aynı yönde hizalandığında otomatik oklar görünür.
- ✅ Ardışık bar filtresi yanlış veya erken sinyalleri azaltır.
- ✅ Hem koyu hem de açık grafik temaları için optimize edilmiş temiz, modern görselleştirme.
- ✅ Çoklu zaman dilimi onaylarını ve trend devam noktalarını tespit etmek için mükemmel.
Bu gösterge, büyük resmi görmek ve tüm zaman dilimleri aynı fikirde olduğunda girmek isteyen tüccarlar için idealdir, daha güçlü ve daha güvenilir işlem düzenleri sağlar.
Özet
YZ özeti
The ADXMultiframeIndicator is a trading indicator for the cTrader platform that identifies market trends by analyzing the Average Directional Movement Index (ADX) across multiple timeframes. It supports up to four customizable timeframes, including M15, H1, H4, and Daily. The indicator displays colored dots to indicate directional bias—green for uptrends and red for downtrends—and automatically shows arrows when all selected timeframes align in the same direction. A consecutive bars filter is included to reduce false or premature signals. The visualization is designed to be clear and modern, compatible with both dark and light chart themes. This tool assists traders in confirming multi-timeframe trends and identifying trend continuation points by highlighting when all timeframes agree, facilitating more informed trade entries. It is particularly useful for analyzing indices markets.
Gösterge profili
Müşteri değerlendirmeleri
5.0
Değerlendirmeler: 2
5 | 100 % | |
4 | 0 % | |
3 | 0 % | |
2 | 0 % | |
1 | 0 % |
Müşteri değerlendirmeleri
October 28, 2025
the first signal should not decide the only input, but it can look better than it is during a lucky run.
Tartışma
SSS
Indices
cTrader Store üzerinden erişilebilen işlem botları, göstergeler ve eklentiler gibi ürünler, üçüncü taraf sağlayıcılar tarafından sağlanır ve yalnızca bilgilendirme ve teknik erişim amaçlarıyla sunulur. cTrader Store bir broker değildir ve yatırım tavsiyesi, kişisel öneriler vermez veya gelecekteki performansı garanti etmez.
Bu oluşturanın diğer ürünleri


Fiyat
Başlangıç 21/01/2025
3
Satışlar