
Descripción
💡 Canales de Regresión Lineal y Puntos ZigZag 💡
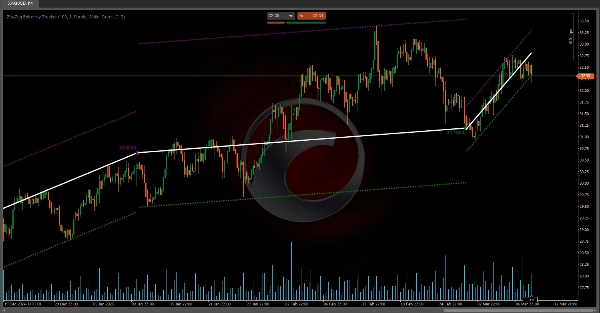
• Los canales de regresión lineal se recalculan y reinician cada vez que el precio se mueve más allá de los límites esperados (bandas), asegurando que la medición se mantenga actualizada con la tendencia real del mercado.
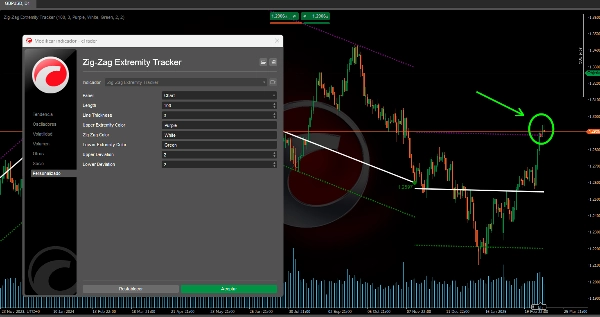
• Los puntos marcados (círculos) representan extremos (máximos y mínimos) que sirven como base para dibujar el ZigZag y determinar desde dónde se calculan los canales.
• Este enfoque dinámico permite una mejor visualización de posibles cambios de tendencia, así como áreas de sobreextensión o sobreventa donde el precio podría revertir hacia la media.
❓ ¿Cómo se relacionan los canales con el ZigZag y los puntos extremos? ❓
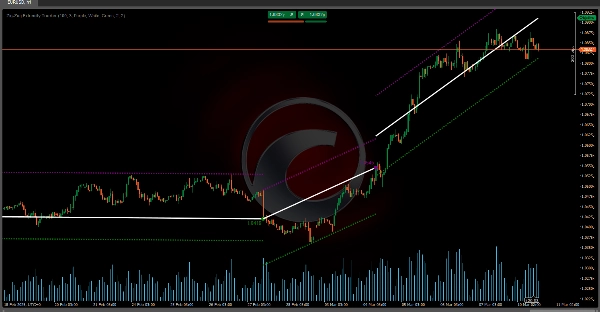
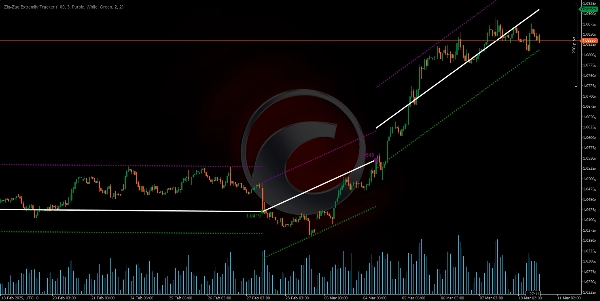
• Cada vez que se detecta un nuevo extremo (máximo o mínimo), el indicador no solo dibuja un círculo y la línea ZigZag que conecta ese punto con el anterior, sino que también reajusta el canal de regresión lineal potencial que se está trazando desde ese último extremo.
• Si, durante las barras siguientes, el precio se mantiene dentro de las bandas, el canal permanece activo y se extiende hasta la barra actual.
• Si en algún momento el precio rompe esas bandas, el indicador “asume” que el canal ha sido invalidado y comienza uno nuevo desde la barra donde ocurrió la ruptura.
Indicadores de Ctrader Store:
Sesiones de Brecha de Valor Justo
Estructura Dinámica del Mercado
Análisis de Puntos de Giro
Regresión Lineal Fibonacci
Multitemporal
Brecha de Valor Justo de Momentum
Proyección de Flujo de Mercado
Gradiente de Tendencia Dinámico
Sesgo de Vela Multinivel
Rastreador
Rastreador de Extremos Zig-Zag
Líneas de Tendencia de Soporte y
Resistencia Automáticas
Todos los Niveles de Soporte y
Resistencia
Mapa de Liquidación de Apalancamiento
Análisis de Estructura Dinámica del Mercado de Puntos de Giro
Regresión Lineal Fibonacci Multitemporal
Proyección de Flujo de Mercado
Gradiente de Tendencia Dinámico
Rastreador de Sesgo de Vela Multinivel
Líneas de Tendencia de Soporte y Resistencia Automáticas
Todos los Niveles de Soporte y Resistencia
Resumen
Valoraciones de clientes
5 | 50 % | |
4 | 50 % | |
3 | 0 % | |
2 | 0 % | |
1 | 0 % |


