
Descripción
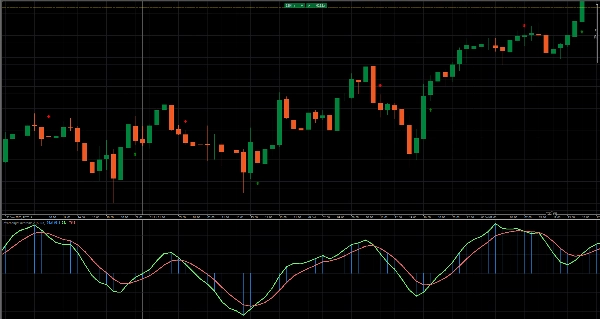
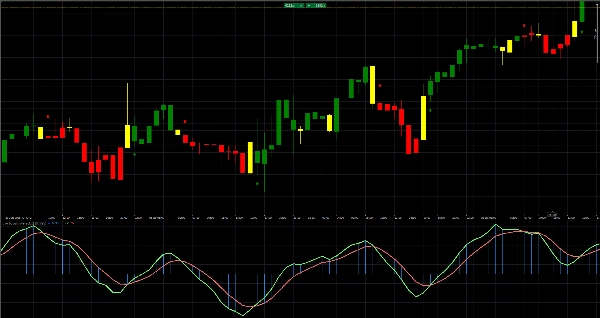
✅ Identifica condiciones de sobrecompra y sobreventa con momentum normalizado
✅ Utiliza un precio central suavizado basado en EMA para una generación de señales estable
✅ Muestra histogramas duales (Oo y Ll) para visualizar la presión del momentum
✅ Barras codificadas por colores muestran instantáneamente fases alcistas, bajistas o indecisas
✅ Marca puntos precisos de COMPRA y VENTA con flechas estrictas de cruce
Mejora tu sincronización con el Indicador de Sobrecompra / Sobreventa: calcula un precio central suavizado (ys1) mediante EMA, normaliza el momentum a través de la desviación estándar y traza histogramas duales (Oo y Ll) junto con líneas EMA ascendentes/descendentes. Las barras codificadas por colores resaltan instantáneamente cambios de momentum alcista (verde), bajista (rojo) o indeciso (amarillo), mientras que las flechas estrictas de cruce marcan puntos precisos de compra y venta. ¡Agrega esta superposición a tu gráfico para señales claras de sobrecompra/sobreventa y sincroniza con confianza tus entradas y salidas!
También disponible como CBOT overbought oversold cbot cBot - cTrader Store
Resumen
Valoraciones de clientes
5 | 100 % | |
4 | 0 % | |
3 | 0 % | |
2 | 0 % | |
1 | 0 % |


