
Descripción
SR COMMANDER — Edición Multitemporal
Ve dónde el gran dinero traza la línea. Opera en tu marco temporal. Piensa en el de ellos.
La mayoría de las herramientas de soporte y resistencia están encadenadas al marco temporal de tu gráfico. Si haces scalping en M1, tus niveles de S/R provienen de velas M1 — pequeñas, ruidosas y fácilmente falsificables. SR Commander MTF rompe esa cadena.
Configura tu gráfico en M1. Configura tu marco temporal SR en H1. Ahora haces scalping con la precisión de un gráfico de un minuto, pero tus niveles de soporte y resistencia se dibujan a partir de las velas horarias donde las instituciones, algoritmos y traders profesionales realmente toman sus decisiones. Esa es la ventaja.
CÓMO FUNCIONA EL MOTOR MULTITEMPORAL
El indicador ejecuta dos flujos de datos independientes simultáneamente.
Tu marco temporal del gráfico controla lo que ves — tus velas, tus entradas, tus flechas, tu sincronización. Tu marco temporal SR controla de dónde provienen los niveles. Estos dos flujos se mapean entre sí en tiempo real, barra por barra. Cuando se cierra una nueva vela del gráfico, SR Commander busca la vela correcta del marco temporal SR para ese momento exacto y recalcula los niveles a partir de la estructura de ese marco temporal superior.
Esto significa que tu línea verde de soporte y tu línea roja de resistencia siempre reflejan la estructura ponderada por volatilidad del marco temporal SR que seleccionaste — no el ruido del gráfico que estás observando.
LA CIENCIA DETRÁS DE LOS NIVELES
SR Commander no solo dibuja líneas en los máximos y mínimos de oscilación. Usa un modelo de volatilidad Yang-Zhang — la misma clase de estimador de volatilidad usado en investigación cuantitativa profesional — para calcular el peso estadístico verdadero de cada vela. Cada nivel se deriva de la estructura de precios normalizada, teniendo en cuenta los gaps nocturnos, el movimiento de apertura a cierre y el rango intrabar. El resultado son niveles que tienen un significado matemático real, no solo prominencia visual.
LO QUE VES EN EL GRÁFICO
- 🟢 Línea verde de soporte — el piso estadísticamente significativo más cercano por debajo del precio actual, obtenido de tu marco temporal SR elegido
- 🔴 Línea roja de resistencia — el techo estadísticamente significativo más cercano por encima del precio actual, obtenido de tu marco temporal SR elegido
- ⬆️ Señal de COMPRA — se activa cuando el precio rebota en el soporte con un cierre alcista confirmado en la vela del marco temporal SR
- ⬇️ Señal de VENTA — se activa cuando el precio rechaza la resistencia con un cierre bajista confirmado en la vela del marco temporal SR
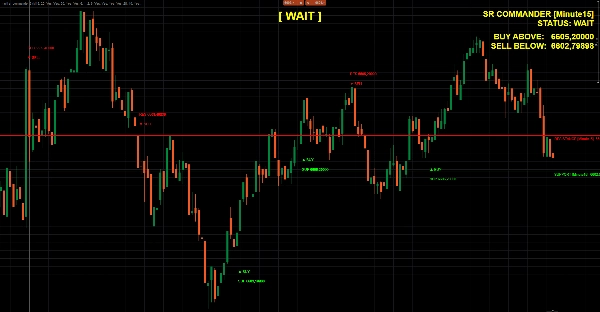
- 📊 Panel en vivo — muestra el marco temporal SR activo, estado actual y precios exactos de activación de ruptura
- 🔵 Etiqueta de estado grande — COMPRA / VENTA / ESPERA, actualizada en cada barra en la parte superior central de tu gráfico
- 🕓 Superposición histórica — rebotes, rechazos, rupturas y caídas marcados en el gráfico para validación visual instantánea
COMBINACIONES DE MARCOS TEMPORALES QUE FUNCIONAN
Gráfico TFSR Marco TemporalCaso de Uso
M1
M5 o M15
Scalping rápido con estructura a corto plazo
M5
H1
Trading intradía con niveles horarios
M15
H4
Entradas swing con estructura de 4 horas
H1
D1
Trading de posición con S/R diario
Cualquiera
Gráfico
Modo clásico — comportamiento original de un solo TF
CARACTERÍSTICAS
- Motor multitemporal completo — cualquier marco temporal SR en cualquier marco temporal de gráfico
- Cálculo de niveles normalizados por volatilidad Yang-Zhang
- Inclusión de la vela más grande — siempre captura la vela de estructura dominante del período de retroceso
- Lógica de señal de rebote y rechazo con tolerancia y buffer configurables
- Detección de ruptura y caída con buffer ajustable
- Superposición de señales históricas para validación inmediata basada en el gráfico
- Panel y etiqueta de estado grande con tamaños y colores de fuente totalmente personalizables
- Cero repintado — todas las señales basadas en velas cerradas cuando el modo de confirmación está activo
¿PARA QUIÉN ES ESTO?
Traders que entienden que las mejores entradas están en marcos temporales bajos, pero los mejores niveles están en los más altos. Si alguna vez has dibujado niveles H4 a mano mientras operas en M5 — SR Commander automatiza todo ese proceso, lo mantiene matemáticamente fundamentado y pone la señal directamente en tu gráfico en el momento en que el precio reacciona.
Estructura de marco temporal superior. Precisión de marco temporal inferior. Un indicador.
Resumen
The indicator calculates S/R levels using the Yang-Zhang volatility model, which accounts for overnight gaps, open-to-close movement, and intrabar range to produce statistically significant levels rather than simple swing highs and lows. On the chart, it shows a green support line and a red resistance line representing the nearest significant levels below and above the current price from the chosen S/R timeframe.
Additional features include buy and sell signals triggered by price reactions to these levels confirmed on the S/R timeframe, a live dashboard displaying current status and breakout prices, a large status label indicating BUY, SELL, or WAIT, and historical overlays marking past bounces, rejections, and breakouts. The indicator supports various timeframe combinations suitable for scalping, intraday, swing, and position trading across markets including forex, indices, commodities, stocks, and crypto.
Valoraciones de clientes
5 | 50 % | |
4 | 50 % | |
3 | 0 % | |
2 | 0 % | |
1 | 0 % |


