

Money Flow Profile
Indicador
Versión 1.0, Jul 2026
Windows, Mac

534.4M
Volumen operado
9.76M
Pips ganados
4
Ventas
Descripción
📊 Perfil de Flujo de Dinero
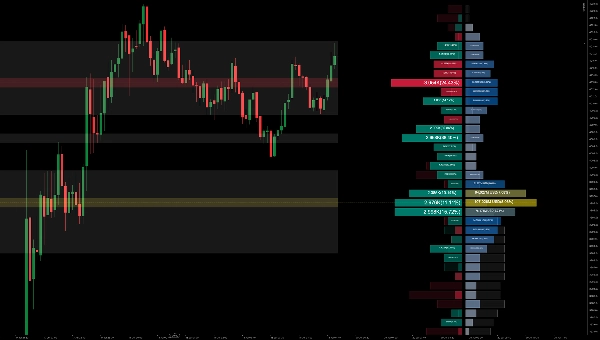
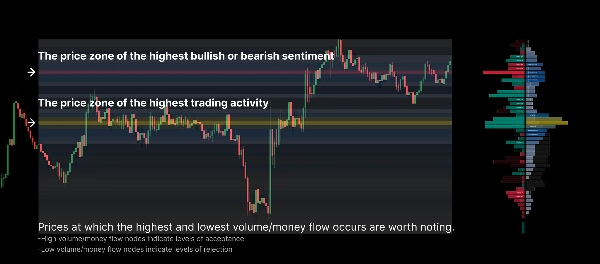
El Perfil de Flujo de Dinero es una herramienta avanzada de gráficos que mide el volumen negociado o el flujo de dinero en todos los niveles de precio del mercado durante un período de tiempo especificado. Destaca la relación entre el precio del activo y la disposición de los traders a comprar o vender, permitiéndote:
- Revelar Niveles Clave de Precio: Identificar fácilmente agrupaciones de volumen y nodos de alta liquidez como el Punto de Control (POC).
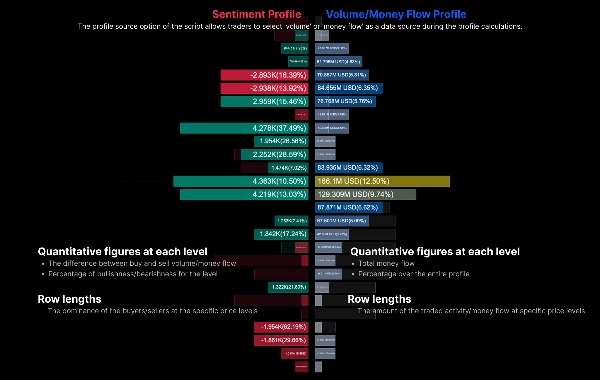
- Analizar el Sentimiento del Mercado: Al mostrar un Perfil de Sentimiento a la izquierda y un Perfil de Volumen a la derecha, determina si los compradores o vendedores dominan en cada nivel de precio específico.
- Comparación entre Períodos: Compara directamente el perfil actual con el perfil fantasma del período anterior para observar cambios en el centro de gravedad del mercado.
⚙️ Parámetros Básicos y Guía de Uso
1. Configuraciones Generales
- Longitud de Retroceso / Rango Fijo: Define el número de barras históricas usadas para calcular el perfil (por ejemplo, las últimas 200 barras).
- Fuente de Datos:
-
1 = Volumen: Calcula el perfil basado en el volumen tradicional de ticks/operaciones.2 = Flujo de Dinero: Incorpora la profundidad de precio para calcular la distribución del flujo de dinero.
2. Configuraciones del Perfil
- Resolución de Filas (Filas): Determina la granularidad del eje vertical. Un número más alto (por ejemplo, 50-100) resulta en un perfil más detallado.
- Ancho del Perfil y Desplazamiento Horizontal: Ajusta qué tan ancho se dibuja el perfil (como porcentaje) y cuánto se desplaza hacia la derecha, evitando que se superponga con la vela actual.
3. Sentimiento y Visualización
- Polaridad del Sentimiento:
-
1 = Vela: Determina el sentimiento alcista/bajista basándose únicamente en la apertura y cierre de la vela (polaridad).2 = Presión de Compra/Venta: Usa un cálculo más preciso que considera las mechas y el cierre relativo al máximo/mínimo.
- Mostrar Perfil de Sentimiento / Perfil de Volumen: Interruptores independientes para mostrar el perfil neto de sentimiento (Izquierda) y el perfil principal de volumen (Derecha).
- Mostrar Período Anterior: Cuando está habilitado, dibuja un perfil de "Barra Fantasma" de fondo que representa la misma ventana temporal del período anterior. Ideal para seguir cambios en soporte/resistencia.
4. Visualización de Área Extendida
- Mostrar Mapa de Calor: Proyecta la densidad del perfil a lo largo de todo el período de cálculo como un mapa de calor de fondo. Puedes elegir proyectar "Volumen" o "Sentimiento".
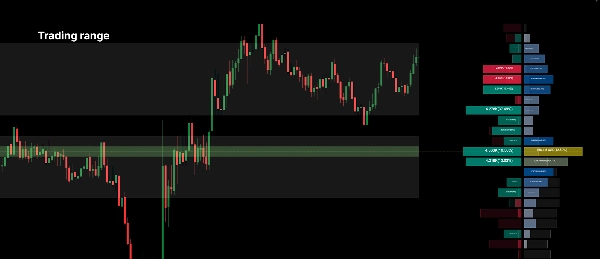
- Mostrar Área de Valor: Resalta el rango central de precios donde ocurrió la mayoría del volumen de negociación. El umbral es personalizable (por ejemplo, 70%).
- Mostrar Zona POC: Dibuja automáticamente una línea horizontal y zona en el Punto de Control (el nivel de precio con mayor volumen) para el rango seleccionado.
💡 Consejos Prácticos para el Trading:
- Busca Nodos de Alto Volumen (Picos) para que actúen como niveles fuertes de soporte o resistencia.
- Busca Nodos de Bajo Volumen (Valles), ya que el precio tiende a moverse rápidamente a través de estas zonas de baja liquidez.
- Usa el Perfil Fantasma del Período Anterior: Si el POC actual (línea amarilla) se está formando más alto que el POC del período anterior, indica que el consenso de valor está desplazándose hacia arriba, lo cual es generalmente una señal alcista.
Resumen
AI summary
Money Flow Profile is an advanced indicator that maps traded volume and market sentiment across price levels over a specified time period. It visualizes the relationship between price and trader activity, highlighting key liquidity zones such as volume clusters and the Point of Control (POC). The tool displays a Sentiment Profile on the left and a Volume Profile on the right, enabling users to assess whether buyers or sellers dominate at each price level. It supports direct comparison with the previous period’s profile via a ghost overlay to track shifts in market value consensus.
Core configurable parameters include lookback length, data source selection (volume or money flow), row resolution for vertical granularity, profile width and offset, and sentiment polarity calculation methods (candle-based or buy/sell pressure). Display options allow toggling of sentiment and volume profiles, previous period overlays, heatmaps of volume or sentiment density, value area highlighting, and automatic POC zone marking.
The indicator is designed to help identify strong support and resistance levels at high volume nodes and anticipate rapid price movements through low volume nodes. It supports detailed volume and sentiment analysis to inform trading decisions based on liquidity and market structure.
Core configurable parameters include lookback length, data source selection (volume or money flow), row resolution for vertical granularity, profile width and offset, and sentiment polarity calculation methods (candle-based or buy/sell pressure). Display options allow toggling of sentiment and volume profiles, previous period overlays, heatmaps of volume or sentiment density, value area highlighting, and automatic POC zone marking.
The indicator is designed to help identify strong support and resistance levels at high volume nodes and anticipate rapid price movements through low volume nodes. It supports detailed volume and sentiment analysis to inform trading decisions based on liquidity and market structure.
Perfil del indicador
Categoría del indicador
Volumen
Tipo de resultado
Visualización
Requisitos de datos
Volumen
DoM
Únicamente barras
Datos de tic
Señales admitidas
Ruptura
Fuerza de la tendencia
Inversión
Volatilidad
Toque de nivel
Ruptura de nivel
Valoraciones de clientes
0.0
Valoraciones: 0
Valoraciones de clientes
Este producto todavía no se ha valorado. ¿Ya lo ha probado? Sea el primero en informar a otros.
Conversación
Preguntas frecuentes
Key Levels
Volume
Los productos disponibles a través de cTrader Store, incluidos bots, indicadores y plugins para operar, son proporcionados por desarrolladores de terceros y están disponibles únicamente con fines informativos y de acceso técnico. cTrader Store no es un bróker, por lo que no proporciona asesoramiento de inversión, recomendaciones personales ni ninguna garantía de rentabilidad futura.
Más de este autor






















Precio
534.4M
Volumen operado
9.76M
Pips ganados
4
Ventas