
Vision - Advanced Session Indicator
Indicador
6 compras
Versión 1.0, Jul 2025
Windows, Mac
5.0
Valoraciones: 2
Descripción
Indicador Avanzado de Sesión
Descripción:
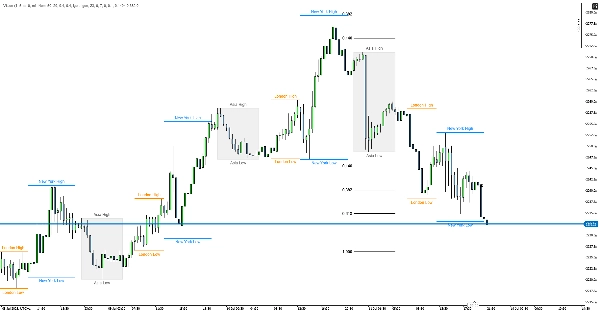
Indicador profesional de sesión para cTrader que muestra los rangos de precios de las principales sesiones de trading y añade análisis de perfil de volumen para cada sesión.
Características Principales:
📊 Cajas y Líneas de Precio de Sesión
- 4 principales sesiones de trading: Asia, Frankfurt, Londres, Nueva York
- Temporización totalmente personalizable: Cada sesión puede configurarse por separado
- Cajas y líneas de rango de precios codificadas por color: Muestra visualmente los valores máximos/mínimos de cada sesión
- Manejo automático de zona horaria
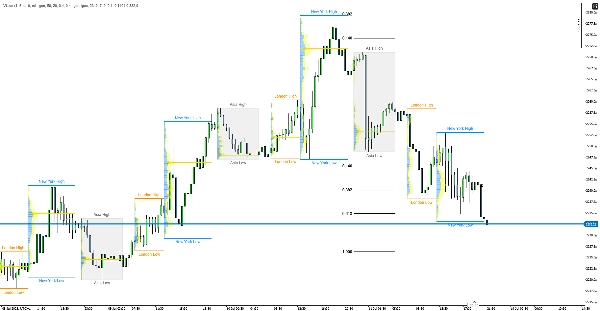
📈 Perfil de Volumen de Sesión
- Visualización de distribución de volumen: Perfil de volumen separado para cada sesión
- Volumen de compra/venta: Colores separados (azul/amarillo)
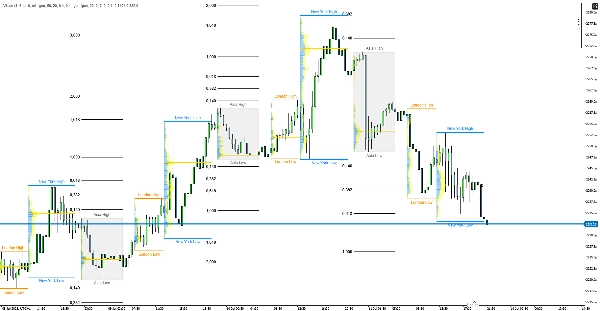
- POC (Punto de Control): Marcando el nivel de precio con mayor volumen
- Resolución personalizable: Histograma de volumen de 10-500 niveles
Configuraciones
Horarios de Sesión
- Asia: 23:00-07:00 (Gris)
- Frankfurt: 07:00-08:00 (Verde Oscuro)
- Londres: 09:00-14:00 (Naranja)
- Nueva York: 14:00-22:00 (Azul)
Opciones Personalizables
- Transparencia y colores de cajas y líneas
- Variación de extensión de la sesión Asia
- Ancho y transparencia del histograma de volumen
- Número de días a mostrar
- Visualización de línea POC
- Marcos temporales separados para cajas de sesión y perfil de volumen
Uso
Aplicación en Trading:
- Niveles altos/bajos de sesión como puntos de soporte/resistencia
- Clústeres de volumen para marcar niveles significativos
- Líneas POC como niveles magnéticos
- Superposiciones de sesiones de importancia destacada
Ventajas: Análisis combinado de acción del precio y volumen, actualizaciones en tiempo real, personalización completa, apariencia profesional.
Resumen
Resumen de IA
Vision - Advanced Session Indicator is a professional tool designed for the cTrader platform to visualize and analyze major trading sessions: Asia, Frankfurt, London, and New York. It displays session price ranges using color-coded boxes and lines, highlighting high and low values for each session. The indicator supports full customization of session times, colors, transparency, and display settings, including separate timeframes for session boxes and volume profiles.
Key features include a session volume profile that shows volume distribution with distinct buy/sell volume colors and marks the Point of Control (POC), the price level with the highest traded volume. Users can customize the volume histogram resolution from 10 to 500 levels. The indicator automatically handles time zones and adjusts for Daylight Saving Time to ensure accurate session tracking.
Vision aids traders by marking session high/low levels as support and resistance points, identifying volume clusters and liquidity zones, and highlighting session overlaps. It is particularly useful for day traders seeking detailed insights into market behavior and potential entry levels based on volume and price action across different trading sessions.
Perfil del indicador
Valoraciones de clientes
5.0
Valoraciones: 2
5 | 100 % | |
4 | 0 % | |
3 | 0 % | |
2 | 0 % | |
1 | 0 % |
Valoraciones de clientes
July 27, 2025
The entry needs one more reason to make sense, but the market context still matters.
July 15, 2025
The practical angle is weak trade ideas become less attractive, and signal count matters more than one nice example.
Conversación
Preguntas frecuentes
Prop
Forex
Indices
Crypto
Los productos disponibles a través de cTrader Store, incluidos bots, indicadores y plugins para operar, son proporcionados por desarrolladores de terceros y están disponibles únicamente con fines informativos y de acceso técnico. cTrader Store no es un bróker, por lo que no proporciona asesoramiento de inversión, recomendaciones personales ni ninguna garantía de rentabilidad futura.


Precio
Desde 05/01/2025
14
Ventas