
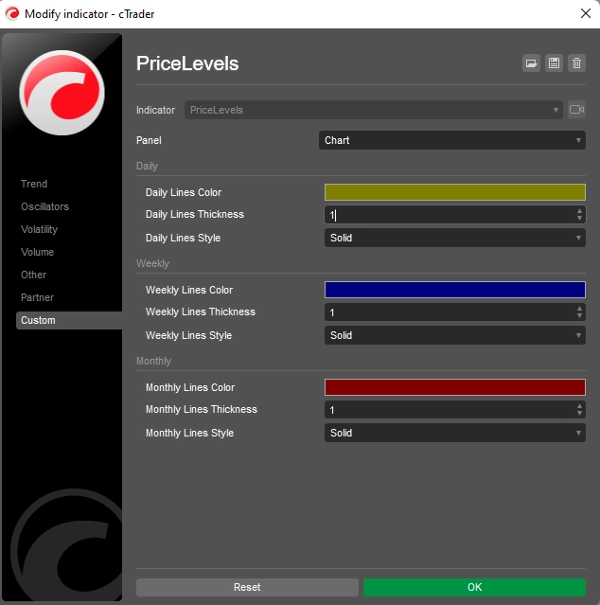
PriceLevels
Indicador
4 compras
Versión 1.0, Jan 2025
Windows, Mac
5.0
Valoraciones: 2
Descripción
Características clave:
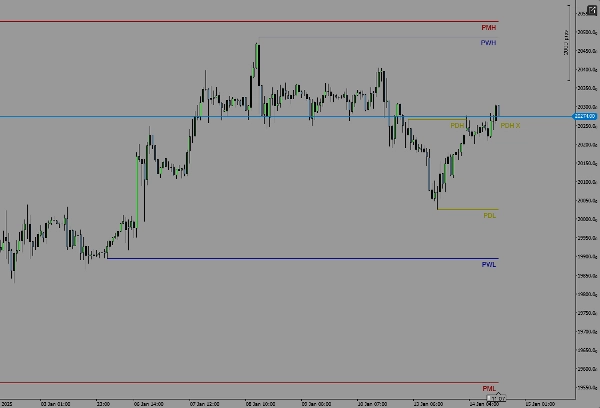
- Muestra los niveles máximos y mínimos de ayer.
- Muestra los niveles máximos y mínimos de la semana pasada.
- Muestra los niveles máximos y mínimos del mes pasado.
- Colores y estilos de línea personalizables para cada nivel.
Cómo funciona:
El indicador calcula automáticamente los precios más altos y más bajos del día, semana y mes anteriores según el marco temporal de su gráfico. Estos niveles se trazan como líneas horizontales en su gráfico, proporcionando una referencia visual clara para la acción histórica del precio.
Compatibilidad:
- Diseñado solo para la plataforma cTrader.
- Funciona en todos los marcos temporales e instrumentos.
Si tiene alguna pregunta, comentario o sugerencia para mejorar, ¡no dude en contactarnos! Su opinión es muy valiosa y ayudará a mejorar aún más este indicador.
¡Feliz trading!
Resumen
Resumen de IA
PriceLevels is an indicator designed for the cTrader platform that automatically calculates and displays key historical price levels on trading charts. It plots the highest and lowest prices from the previous day, last week, and last month as horizontal lines, providing traders with clear visual references for past price action. The indicator supports all timeframes and instruments available on cTrader. Users can customize the colors and line styles for each displayed level to suit their charting preferences. This tool aids in identifying significant support and resistance zones based on recent historical data.
Perfil del indicador
Valoraciones de clientes
5.0
Valoraciones: 2
5 | 100 % | |
4 | 0 % | |
3 | 0 % | |
2 | 0 % | |
1 | 0 % |
Conversación
Preguntas frecuentes
Los productos disponibles a través de cTrader Store, incluidos bots, indicadores y plugins para operar, son proporcionados por desarrolladores de terceros y están disponibles únicamente con fines informativos y de acceso técnico. cTrader Store no es un bróker, por lo que no proporciona asesoramiento de inversión, recomendaciones personales ni ninguna garantía de rentabilidad futura.


![Logotipo de "High-Low Divergence [Iridio Capital]"](https://cdn.ctrader.com/image/webp/443c4661-7abb-40f1-842f-4b6ec560649b_40914)


Precio
Desde 05/01/2025
14
Ventas