
Descripción
---------------------------------------------------------------------------------------
Anuncio de Actualización
¡Nos complace anunciar una actualización clave para nuestro indicador EnhancedSupportResistance! Esta actualización se centra en mejorar el manejo de los objetos del gráfico, asegurando que tus anotaciones y dibujos personalizados permanezcan intactos.
Novedades:
- Eliminación Selectiva de Objetos: Nuestro indicador ahora elimina selectivamente solo los objetos que crea, evitando la eliminación accidental de objetos del gráfico no relacionados.
- Experiencia de Usuario Mejorada: Disfruta de una experiencia más fluida y confiable, con tus anotaciones y dibujos importantes intactos durante las actualizaciones del indicador.
---------------------------------------------------------------------------------------
LevelMaster S/R - Domina los Niveles Clave del Mercado
Descripción:
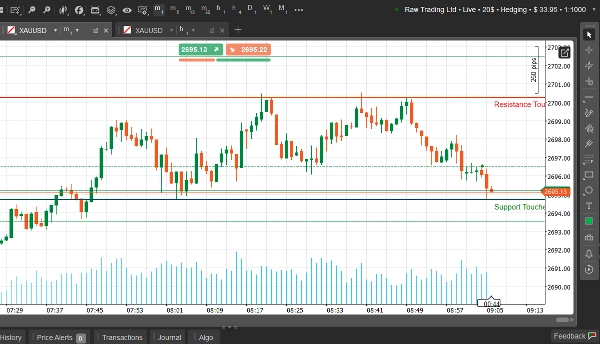
LevelMaster S/R es un indicador de trading potente y diseñado con precisión para darte ventaja al identificar con exactitud niveles críticos de soporte y resistencia. Creado para traders de todos los niveles, esta herramienta analiza la acción del precio en el marco temporal que elijas y resalta las zonas más relevantes, ayudándote a tomar decisiones de trading informadas con confianza.
Ya seas un scalper, trader diario o swing trader, LevelMaster S/R te proporciona las ideas que necesitas para navegar mercados volátiles y encontrar oportunidades rentables.
Características Clave:
🔥 Zonas Precisas de Soporte y Resistencia
- Detecta automáticamente los niveles más fuertes basados en la acción del precio, fractales y valores ATR.
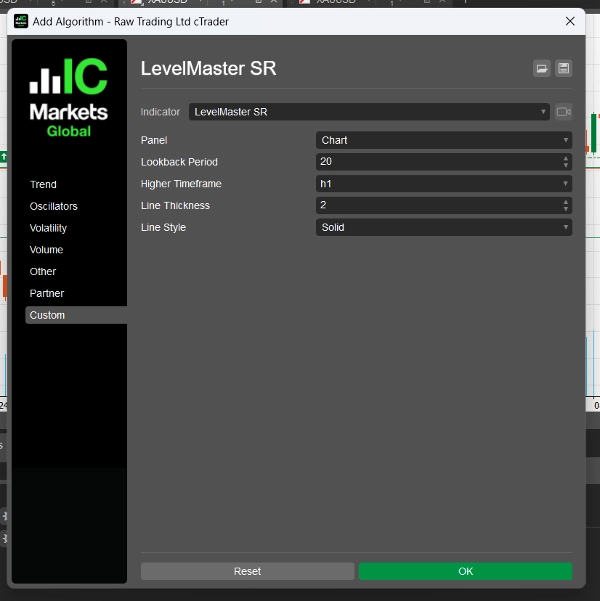
⏱ Análisis Multitemporal
- Analiza y muestra niveles clave de cualquier marco temporal que elijas, directamente en tu gráfico.
📊 Visuales Personalizables
- Ajusta estilos de línea, colores y grosor para una integración perfecta en el gráfico.
🔔 Alertas en Tiempo Real
- Recibe notificaciones por sonido, correo electrónico o móvil cuando el precio se acerca a los niveles seleccionados.
💡 Configuraciones Amigables
- Opciones de entrada intuitivas que hacen la configuración rápida y sencilla, incluso para principiantes.
¿Por Qué Elegir LevelMaster S/R?
✔ Mejora en la Toma de Decisiones: Deja de adivinar y comienza a operar con confianza.
✔ Ahorra Tiempo: Deja que el indicador haga el trabajo pesado identificando zonas por ti.
✔ Funciona en Todos los Mercados: Perfecto para Forex, Acciones, Commodities y Cripto.
✔ Creado por Traders, para Traders: Diseñado con características que los traders reales necesitan.
¿Quién Debería Usar LevelMaster S/R?
- Scalpers: Identifica zonas intradía para operaciones rápidas.
- Swing Traders: Detecta niveles fuertes para movimientos de precio más grandes.
- Principiantes: Simplifica el análisis del mercado para un aprendizaje fácil.
- Profesionales: Mejora estrategias existentes con datos confiables.
Resumen
Valoraciones de clientes
5 | 50 % | |
4 | 50 % | |
3 | 0 % | |
2 | 0 % | |
1 | 0 % |


