
FVG & Imbalance Detector
Indicador
2 compras
Versión 1.0, Jan 2026
Windows, Mac
4.0
Valoraciones: 2
Descripción
En el mundo de Smart Money Concepts (SMC) y ICT, los desequilibrios de precio son las "huellas dactilares" de los grandes jugadores institucionales. Cuando el mercado se mueve demasiado rápido, deja atrás un Fair Value Gap (FVG)—una zona de ineficiencia a la que el precio casi siempre regresa para "llenar" o volver a probar.
El FVG & Imbalance Detector para cTrader es una herramienta de alto rendimiento diseñada para detectar estas ineficiencias automáticamente. No más dibujo manual: obtén zonas claras y accionables directamente en tu gráfico.
Por qué este indicador es imprescindible:
- 🚀 Detecta movimientos institucionales: Observa dónde los grandes bancos y fondos de cobertura han entrado al mercado con volumen masivo.
- 🎯 Zonas de alta probabilidad: Utiliza los desequilibrios identificados como objetivos magnéticos para tomar ganancias o como "Zonas Doradas" para entradas precisas.
- 📈 Visualización limpia: Superposiciones rectangulares de alta calidad que hacen que el análisis de tendencias sea sencillo.
- 🔧 Totalmente flexible: A diferencia de los indicadores básicos, esta versión te permite extender las zonas hacia el futuro o ajustar sus puntos de inicio para que coincidan con tu estrategia específica.
Características exclusivas:
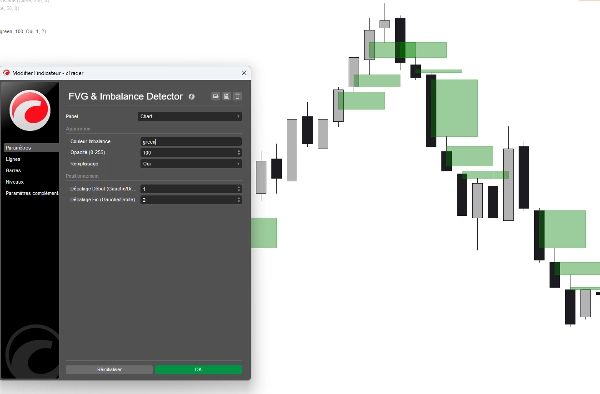
- Lógica de detección inteligente: Algoritmo avanzado que identifica ineficiencias tanto en la parte superior (bajista) como en la inferior (alcista) con precisión de píxel.
- Desplazamientos bidireccionales: Parámetros exclusivos de desplazamiento "Inicio" y "Fin" que te permiten proyectar las zonas hacia adelante o hacia atrás para ver cómo los gaps históricos se alinean con la acción actual del precio.
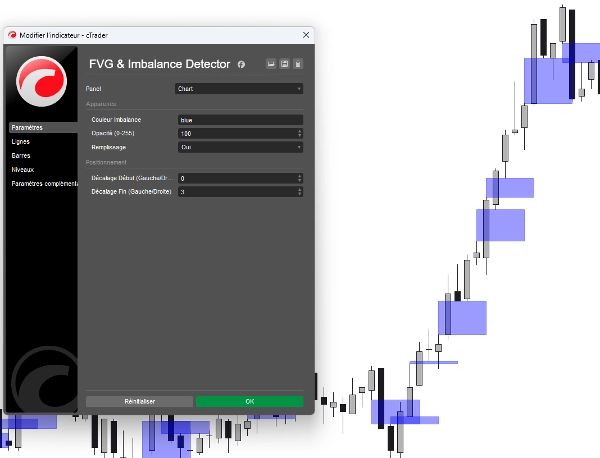
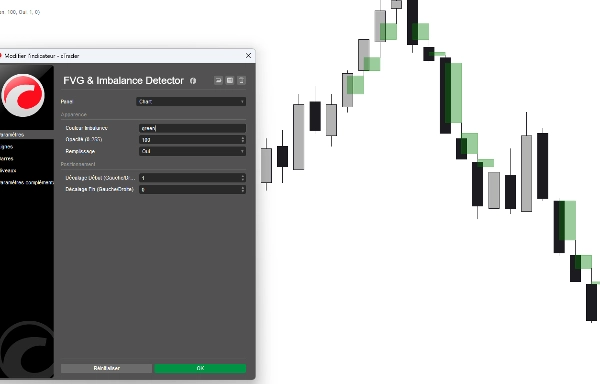
- Interfaz profesional de colores: Elige tu estilo preferido mediante un menú desplegable limpio (Amarillo, Aqua, Rojo, etc.)—¡no más escribir códigos hexadecimales!
- Control de opacidad: Ajusta la transparencia para que las zonas no saturen tu vista de la acción del precio.
- Rendimiento optimizado: Código ligero que no ralentizará tu plataforma cTrader, incluso en múltiples gráficos.
Cómo usarlo:
- Identifica el gap: El indicador dibuja un cuadro donde ocurre un desequilibrio entre el máximo de la primera vela y el mínimo de la tercera.
- Espera la prueba: Observa cómo el precio regresa a estos cuadros.
- Ejecuta: Busca patrones de rechazo dentro de la zona FVG para entradas de bajo riesgo y alta recompensa.
Resumen
Resumen de IA
The FVG & Imbalance Detector is an indicator for the cTrader platform designed to identify Fair Value Gaps (FVG) and price imbalances, key concepts in Smart Money Concepts (SMC) and Institutional Cycle Trading (ICT). These gaps represent zones of market inefficiency created by rapid price moves, often reflecting institutional activity. The indicator automatically detects and highlights these zones on the chart with clear rectangular overlays, eliminating the need for manual drawing.
Key features include detection of both bullish (bottom) and bearish (top) imbalances with high precision, customizable zone extensions via start and end offset parameters, and adjustable opacity and color settings for clear visualization. The tool is optimized for performance to avoid slowing down the platform, even when applied to multiple charts.
Traders can use the indicator to spot where large institutional players have entered the market, identify high-probability zones for entries or take-profits, and monitor price retests of these inefficiency zones for potential trade execution. The indicator supports analysis across various markets including Forex, Indices, Commodities, and Crypto.
Perfil del indicador
Valoraciones de clientes
4.0
Valoraciones: 2
5 | 0 % | |
4 | 100 % | |
3 | 0 % | |
2 | 0 % | |
1 | 0 % |
Valoraciones de clientes
January 18, 2026
tested small first and that felt like the right move, and account protection still comes first.
January 14, 2026
Conversación
Preguntas frecuentes
Forex
Indices
Commodities
Crypto
AI
Los productos disponibles a través de cTrader Store, incluidos bots, indicadores y plugins para operar, son proporcionados por desarrolladores de terceros y están disponibles únicamente con fines informativos y de acceso técnico. cTrader Store no es un bróker, por lo que no proporciona asesoramiento de inversión, recomendaciones personales ni ninguna garantía de rentabilidad futura.
Más de este autor


Precio
Desde 27/10/2025
10
Ventas