
Mô tả
Khái niệm "Kỹ thuật đảo ngược"
Đổi mới chính của chỉ báo này nằm ở thuật toán Kỹ thuật đảo ngược. Thông thường, một dao động ngẫu nhiên lấy dữ liệu giá và chuyển đổi nó thành một số từ 0 đến 100. Chỉ báo này làm ngược lại: nó lấy các mức toán học của dao động và chiếu lại chúng lên thang giá.
Điều này cho phép nhà giao dịch chuyển đổi động lượng toán học thành mức giá cụ thể (đô la hoặc pips) trực tiếp trên biểu đồ.
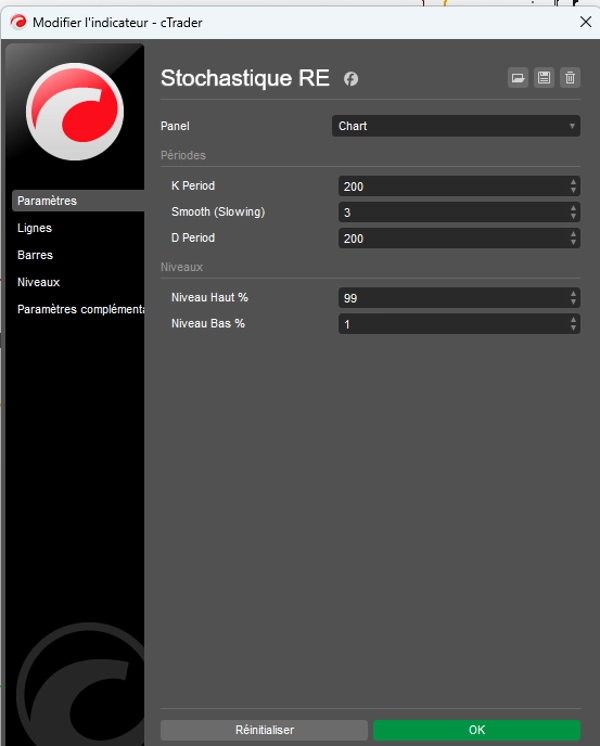
Xác định Ranh giới: Trần (99%) và Sàn (1%)
Không giống như các thiết lập cổ điển (80/20), chỉ báo này được đặt mặc định là 1% và 99%. Cấu hình này có mục đích cụ thể: nó xác định giới hạn vật lý của giá.
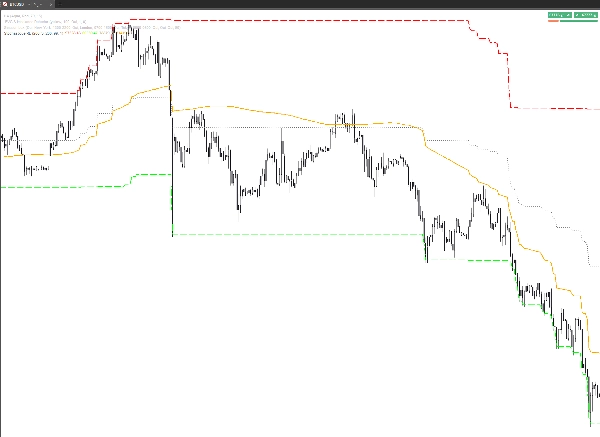
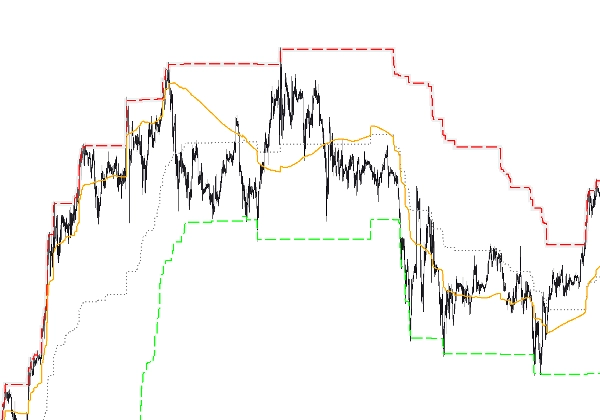
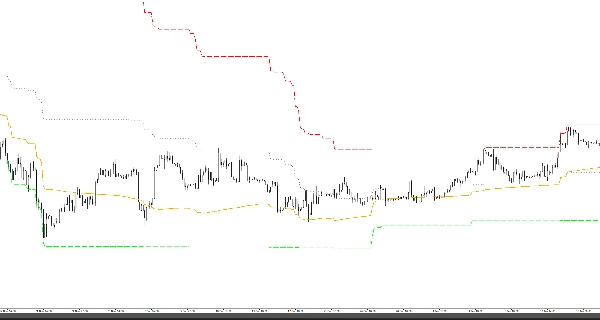
- Mức 99% (Trần giá): Nó xác định mức giá cao nhất mà thị trường có thể đạt được trước khi được coi là đã cạn kiệt 99% biên độ di chuyển trong khoảng thời gian đã cho. Đây là "ranh giới" giá.
- Mức 1% (Sàn giá): Nó xác định mức giá thấp nhất, là hỗ trợ cuối cùng của chu kỳ hiện tại. Đây là mức mà giá đã cạn kiệt 99% khả năng giảm so với lịch sử gần đây của nó.
Tại sao nó "Xác định Giá"?
Nhờ hệ thống này, đường Tín hiệu Cam %D không còn chỉ là một đường cong di chuyển trong chân không.
- Định vị Giá: Nó cho thấy vị trí chính xác của "giá hợp lý" được cân nhắc theo động lượng của nó.
- Bản đồ Phạm vi: Nó biến biểu đồ thành một bản đồ nơi bạn có thể thấy liệu giá hiện tại "đáng giá" 1% hay 99% tiềm năng của nó.
- Mục tiêu Cụ thể: Nếu đường màu cam di chuyển lên, nó không chỉ đơn giản là cố gắng đạt đến "80"; nó đang cố gắng đạt đến mức giá chính xác được hiển thị bởi đường màu đỏ (99%).
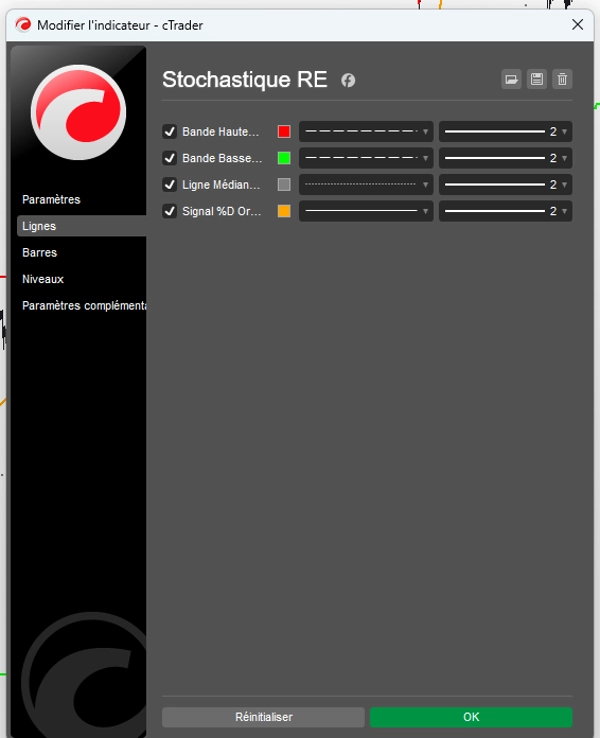
Chức năng các Đường (Tab Lines)
Mọi thứ đều có thể tùy chỉnh để đọc trực quan ngay lập tức:
- Dải Trên (99%): Trần giá lý thuyết.
- Dải Dưới (1%): Sàn giá lý thuyết.
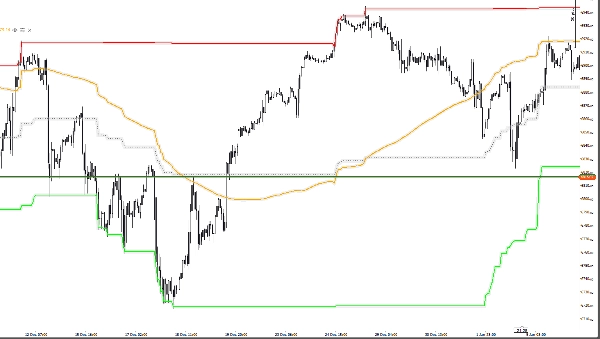
- Đường Giữa (50%): Điểm xoay trung tâm, vùng cân bằng.
- Tín hiệu Cam %D: Con trỏ động điều hướng giữa sàn và trần để xác định hướng thị trường.
Tóm tắt cho Nhà giao dịch
Chỉ báo này không chỉ cho bạn biết thị trường đang "quá mua"; nó cho bạn thấy chính xác ở mức giá nào thị trường trở nên quá đắt (99%) hoặc quá rẻ (1%). Đây là một công cụ chính xác đưa toán học trở lại với thực tế của sổ lệnh.
Tóm tắt
The indicator displays these boundaries directly on the price chart, allowing traders to see exact price levels where the market is considered overbought or oversold. Key features include customizable lines for the upper band (99%), lower band (1%), mid line (50%), and an orange signal %D line that dynamically indicates market direction between these boundaries.
By translating momentum into precise price targets, Stochastique RE helps traders localize fair price zones, map price ranges, and identify concrete price targets rather than abstract oscillator values. It supports various markets including Forex, stocks, commodities, indices, and cryptocurrencies, with symbol tags such as BTCUSD, EURUSD, GBPUSD, XAUUSD, NAS100, and USDJPY.
Đánh giá của khách hàng
5 | 67 % | |
4 | 33 % | |
3 | 0 % | |
2 | 0 % | |
1 | 0 % |


