
Automatic Fibonatti
Indicador
3 compras
Versión 1.2, Apr 2026
Windows, Mac
5.0
Valoraciones: 2
Descripción
Auto Fibonacci para cTrader
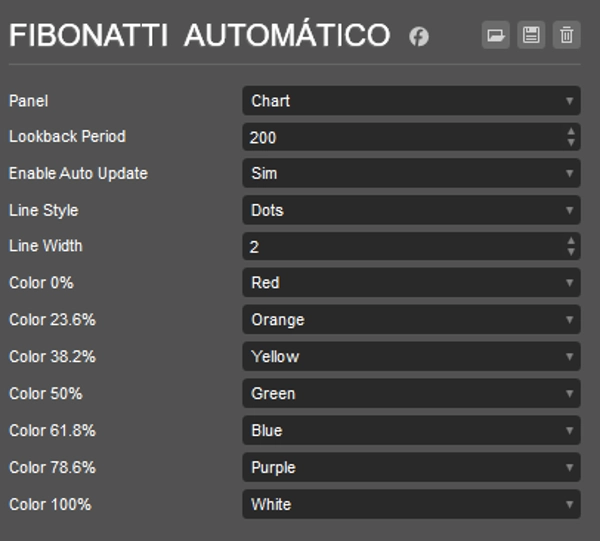
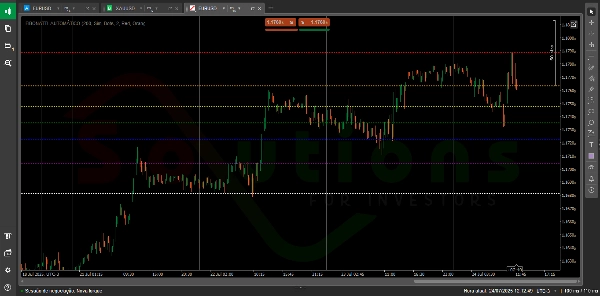
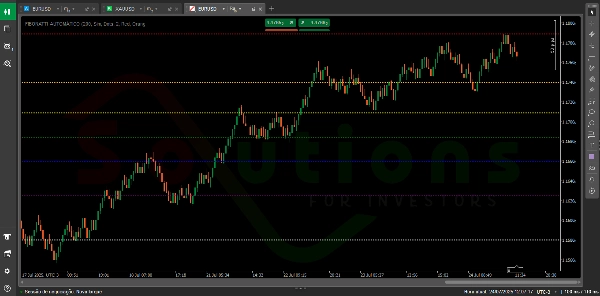
Identifique automáticamente los niveles clave de precios — totalmente personalizable según su estrategia.
Auto Fibonacci es un indicador inteligente y flexible que dibuja automáticamente los niveles de retroceso de Fibonacci basándose en los precios más altos y más bajos durante un período definido por el usuario. Lo que lo distingue es su personalización completa: personalice el color, estilo de línea y grosor de cada nivel de Fibonacci para adaptarse a sus preferencias visuales y estrategia de trading. También cuenta con actualizaciones en tiempo real, por lo que su gráfico siempre refleja la acción de precio más reciente — sin necesidad de ajustes manuales.
Resumen
Perfil del indicador
Valoraciones de clientes
5.0
Valoraciones: 2
5 | 100 % | |
4 | 0 % | |
3 | 0 % | |
2 | 0 % | |
1 | 0 % |
Valoraciones de clientes
March 7, 2025
The product earns time when it gives the trader a reason to pause. It should not replace the chart.
February 28, 2025
there is less room for random clicking, but manual context is still required.
Conversación
Preguntas frecuentes
BTCUSD
Forex
Signal
Indices
EURUSD
Commodities
GBPUSD
NZDUSD
Fibonacci
Prop
Scalping
Crypto
Stocks
XAUUSD
NAS100
USDJPY
Los productos disponibles a través de cTrader Store, incluidos bots, indicadores y plugins para operar, son proporcionados por desarrolladores de terceros y están disponibles únicamente con fines informativos y de acceso técnico. cTrader Store no es un bróker, por lo que no proporciona asesoramiento de inversión, recomendaciones personales ni ninguna garantía de rentabilidad futura.


Precio
Desde 05/02/2025
31
Ventas