
Descripción
Nota: Probado solo en cTrader Windows.
LT_Ind_Pivot es un indicador de Puntos Pivote potente y personalizable para cTrader que ayuda a visualizar niveles clave del mercado y estructuras de sesión en múltiples marcos temporales.
Calcula y traza automáticamente Pivote (P), Soporte (S1–S5), Resistencia (R1–R5), y CPR (TC/BC) basándose en el marco temporal ancla que elijas — desde H1, H4, H8, H12, D1, W1, hasta Month1.
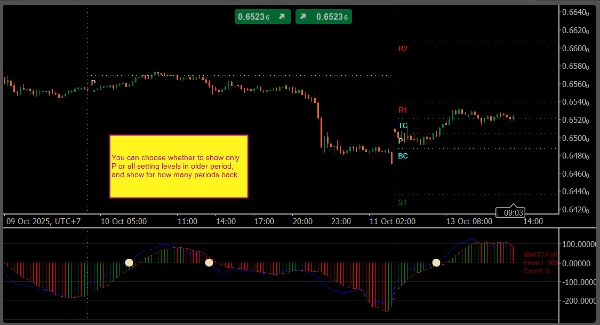
El indicador también dibuja líneas separadoras verticales para cada período ancla, tanto en el gráfico principal como en los paneles del indicador, facilitando distinguir los límites de sesión o período.
Puedes definir exactamente qué niveles mostrar usando una notación flexible como:
P, S1, R1– niveles estándarPS1,S1S2,R1R2, etc. – niveles intermedios entre pivotes y soportes/resistencias principalesTC,BC– Rango Central de Pivote (CPR)
Los controles de visualización te permiten establecer cuántos pivotes históricos mantener visibles, si mostrar etiquetas de texto/precio y cómo colorear o estilizar cada nivel.
Características principales
- Anclas de pivote: H1, H4, H8, H12, D1, W1, Month1
- Sintaxis de nivel personalizada:
P, Sx, Rx, PS1, S1S2, R1R2, TC, BC - Separadores verticales de período en el gráfico y paneles del indicador
- Opción para mostrar texto, precios y niveles de pivote antiguos
- Personalización completa de color y estilo de línea
- Ligero y adecuado para trading en vivo
Configuración predeterminada
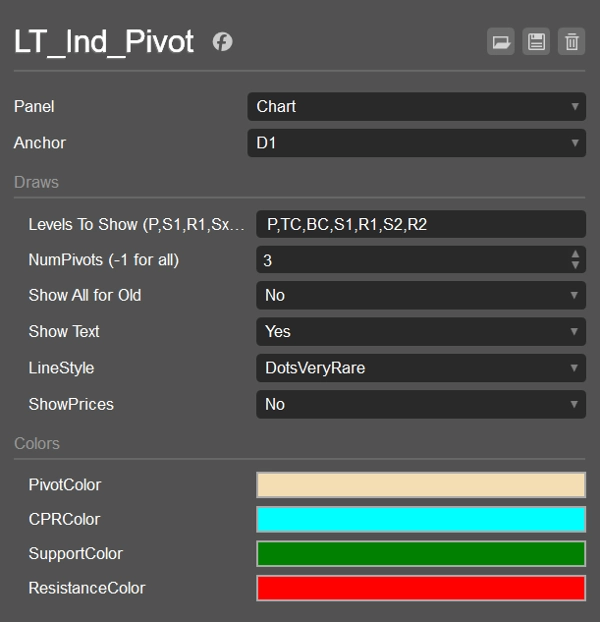
- Ancla: D1
- Mostrar niveles:
P,S1,R1 - NumPivotsBack: 1
- ShowAllForOldPivots: false
- Mostrar texto: true
- Mostrar precios: false
- Estilo de línea: Sólido
- Colores: Pivote = Trigo, CPR = Cian, Soporte = Verde, Resistencia = Rojo
Casos de uso
- Marcar zonas de soporte/resistencia intradía y swing
- Rastrear CPR y niveles intermedios para configuraciones de ruptura o reversión a la media
- Usar separadores de período para analizar la estructura sesión por sesión
- Combinar con indicadores VWAP o Swing para mayor confluencia
Resumen
Valoraciones de clientes
5 | 0 % | |
4 | 100 % | |
3 | 0 % | |
2 | 0 % | |
1 | 0 % |


