
LT_SmartSwings
Indicador
6 compras
Versión 1.0, Jun 2025
Windows, Mac
5.0
Valoraciones: 1
Descripción
Nota: Probado solo en cTrader Windows.
LT_SmartSwings es un potente indicador de estructura de mercado basado en swings diseñado para ayudar a los traders a visualizar puntos clave de giro, movimientos del mercado y eventos de ruptura con claridad y flexibilidad. Construido para precisión y adaptabilidad, esta herramienta es ideal para traders que dependen de la lógica de swings, la confluencia de Fibonacci y el análisis de rupturas.
Características principales:
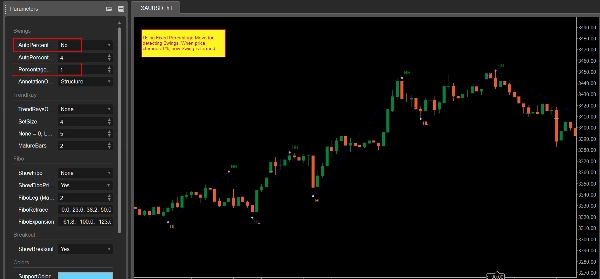
- Detección de Máximos/Mínimos de Swing basada en el porcentaje de movimiento del precio
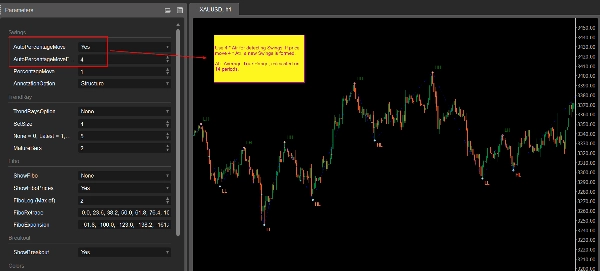
- Umbral Automático o Manual: Usa un % fijo o modo automático (basado en ATR x factor)
- Línea ZigZag que conecta swings clave
- Anotaciones Detalladas con 5 modos:
-
- Estructura: HH, HL, LH, LL
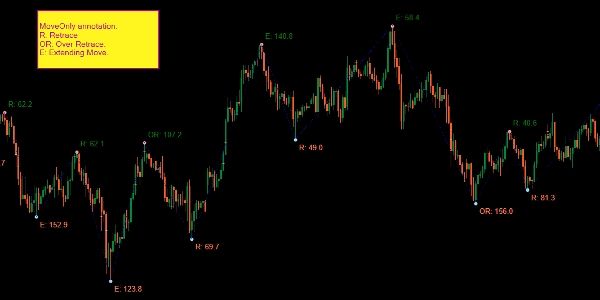
- SoloMovimiento: Porcentajes de retroceso (R) y extensión (E)
- SoloPrecio
- MovimientoYPrecio
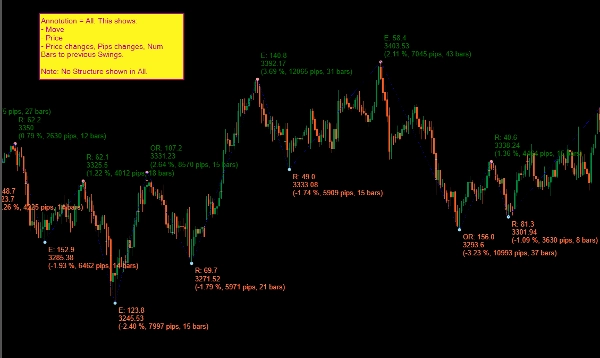
- Todo: %, pips, barras, precio, tipo de movimiento
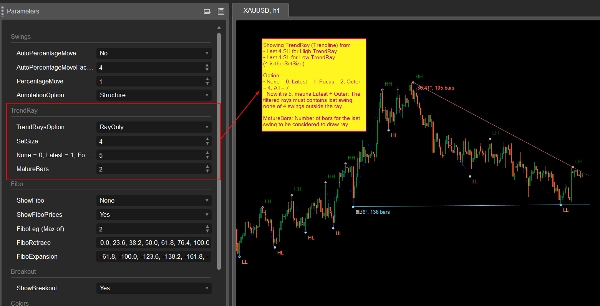
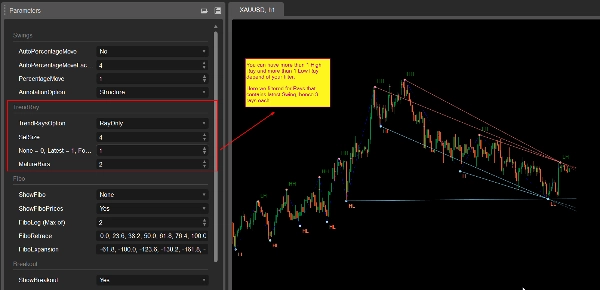
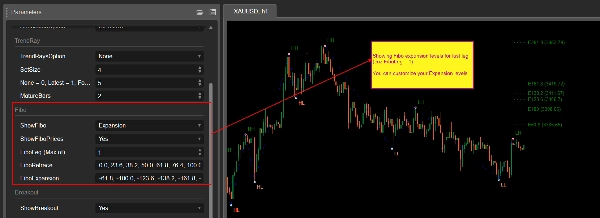
- Proyección de Rayo de Tendencia (con múltiples opciones de filtrado):
-
- Dibuja rayos desde swings recientes usando restricciones inteligentes
- Opciones: Último, Enfoque (pendiente), Externo o Todos
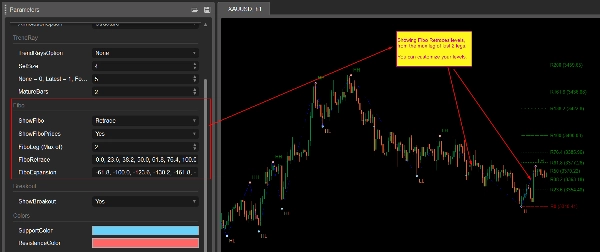
- Niveles Automáticos de Fibonacci:
-
- Dibuja niveles de retroceso o expansión basados en movimientos recientes
- Conjuntos de niveles configurables por el usuario
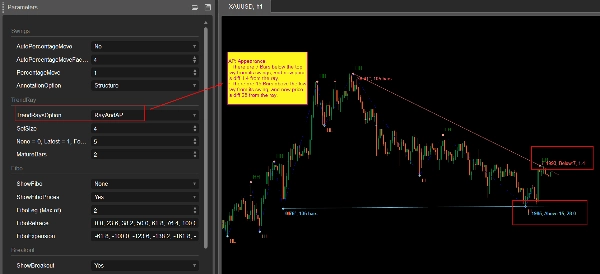
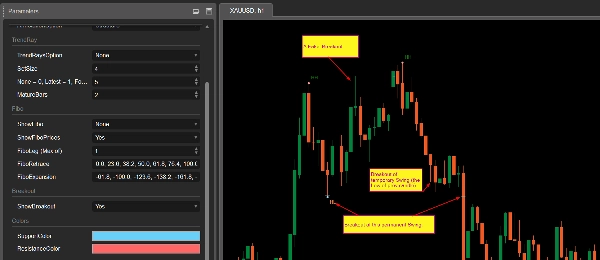
- Marcado de Rupturas:
-
- Detecta rupturas de puntos de swing (tanto confirmadas como falsas)
- Visualización persistente para referencia histórica
- Personalización de Color para líneas de soporte/resistencia
Casos de Uso:
- Identificar soporte/resistencia dinámicamente
- Entender la estructura y transiciones de swings
- Detectar continuación o reversión de tendencia usando Fibs
- Visualizar puntos de ruptura para planificación de operaciones
- Combinar con tus sistemas existentes o estrategia discrecional
Uso Recomendado:
- Adjuntar a tu marco temporal de trabajo (p. ej., M30, H1)
- Más adecuado para traders manuales, analistas de estructura y estrategias basadas en confirmación
Oferta de lanzamiento: ¡Disponible ahora por solo $15!
Resumen
Resumen de IA
LT_SmartSwings is a swing-based market structure indicator designed for traders to identify key turning points, market moves, and breakout events with precision and flexibility. It detects swing highs and lows based on price movement percentage, using either fixed or automatic thresholds derived from ATR. The indicator connects key swings with a ZigZag line and provides detailed annotations in five modes, including structure (HH, HL, LH, LL), move percentages, price-only, combined move and price, and comprehensive move data.
Additional features include trend ray projection with multiple filtering options, automatic Fibonacci retracement and expansion levels customizable by the user, and breakout marking that detects both confirmed and false breakouts with persistent historical display. Support and resistance lines can be color-customized.
Use cases cover dynamic support/resistance identification, understanding swing structure and transitions, spotting trend continuation or reversal via Fibonacci levels, visualizing breakout points for trade planning, and integration with existing trading systems or discretionary strategies. It is recommended for manual traders, structure analysts, and confirmation-based strategies, and is intended for use on working timeframes such as M30 or H1. The indicator has been tested on cTrader Windows.
Perfil del indicador
Valoraciones de clientes
5.0
Valoraciones: 1
5 | 100 % | |
4 | 0 % | |
3 | 0 % | |
2 | 0 % | |
1 | 0 % |
Conversación
Preguntas frecuentes
Breakout
ATR
Los productos disponibles a través de cTrader Store, incluidos bots, indicadores y plugins para operar, son proporcionados por desarrolladores de terceros y están disponibles únicamente con fines informativos y de acceso técnico. cTrader Store no es un bróker, por lo que no proporciona asesoramiento de inversión, recomendaciones personales ni ninguna garantía de rentabilidad futura.


Precio
Desde 25/09/2024
34
Ventas