Descrição
Viés da Estrutura Heikin Ashi (Indicador cTrader)
Zonas automáticas de oferta e demanda com viés em múltiplos períodos de tempo.
O que ele faz – em linguagem simples
Este indicador automaticamente:
- Lê a ação de preço Heikin Ashi e detecta mudanças significativas de pivô.
- Constrói zonas dinâmicas de suporte e resistência ao redor desses pivôs, usando tanto a extremidade do pavio quanto o corpo da vela (não apenas linhas aleatórias).
- Funde zonas próximas de forma inteligente para que você veja níveis limpos e negociáveis em vez de uma floresta de linhas horizontais.
- Gera um viés claro de alta ou baixa sempre que o preço rompe completamente a última zona de suporte ou resistência.
- Mostra o viés para:
-
- Seu período do gráfico, e
- Um período superior opcional (padrão H2) — sem desenhar confusão do HTF no seu gráfico.
Resultado: um olhar rápido mostra onde estão os níveis reais e se o mercado está atualmente tendendo para cima ou para baixo.
O problema que ele resolve
A maioria dos traders tem os mesmos problemas:
- Linhas de suporte/resistência desenhadas à mão são:
-
- subjetivas,
- inconsistentes,
- e frequentemente exageradas.
- Indicadores simples de “zigzag + linha horizontal”:
-
- não lidam corretamente com a largura da zona,
- empilham níveis uns sobre os outros,
- ou estendem as zonas tanto que cobrem metade do gráfico.
- O viés muitas vezes fica “na sua cabeça” – não algo que você possa ver claramente ou usar de forma baseada em regras.
Este indicador foi criado para:
- Transformar a estrutura Heikin Ashi em zonas claras e objetivas,
- Dar a você um viés/tendência baseado em regras baseado nessas zonas,
- Enquanto mantém o gráfico limpo e legível.
Como as zonas são construídas (explicação amigável para traders)
Para cada pivô Heikin Ashi, o indicador observa uma estrutura de 3 velas:
- Quando o HA muda de vermelho para verde, marca um pivô de suporte.
- Quando o HA muda de verde para vermelho, marca um pivô de resistência.
Então ele constrói a zona:
Zonas de suporte
- Encontra o pavio mais baixo entre as 3 velas (extremo verdadeiro).
- Encontra o próximo menor mínimo que ainda é maior que esse extremo.
- Usa o corpo da vela (abertura/fechamento) próximo a esse mínimo interno para definir o lado “negociável” da zona.
- Zona final de suporte:
-
- Base = pavio extremo baixo,
- Topo = nível interno baseado no corpo.
Zonas de resistência
- Encontra o pavio mais alto entre as 3 velas.
- Encontra o próximo maior máximo que ainda é menor que esse extremo.
- Usa o corpo próximo a esse máximo interno.
- Zona final de resistência:
-
- Topo = pavio extremo alto,
- Base = nível interno baseado no corpo.
Então cada zona não é apenas uma faixa arbitrária:
É uma faixa do pavio ao corpo que representa onde o preço realmente rejeitou ou reverteu.
Lógica de fusão (por que o gráfico permanece limpo)
Zonas do mesmo tipo (suporte com suporte, resistência com resistência):
- São tratadas como unidades em uma linha do tempo.
- Só podem se fundir se realmente se sobrepuserem em preço.
- A fusão é estritamente local:
-
- Uma nova zona pode se fundir com:
-
- a zona mais recente (lado a lado), ou
- a segunda zona mais recente (+1 intervalo), e
- Uma fusão “âncora” adicional atrás disso se a nova zona combinada agora se sobrepõe à estrutura anterior.
Isso mantém o comportamento intuitivo:
- As zonas não “engolem” todo o histórico.
- Níveis mais antigos são respeitados, mas não permitem a criação de mega-zonas gigantes.
- Estruturas locais como A–B–C ou A–C+D são tratadas de forma controlada.
Lógica do viés (como você realmente negocia com ele)
Para cada período de tempo (principal e HTF):
- O indicador acompanha a última zona de suporte fundida e a última zona de resistência fundida.
- Então, em cada vela fechada:
-
- Se o preço fecha acima da última zona de resistência → o viés se torna Altista.
- Se o preço fecha abaixo da última zona de suporte → o viés se torna Baixista.
Ele armazena:
- O tempo da última mudança de viés,
- O nível de preço no qual o preço rompeu a zona.
No gráfico, um pequeno painel de texto mostra:
Viés Principal (H1): AltistaMudança Principal (H1): 26/11 15:00 @1.08750
Se o HTF estiver ativado, você também verá algo como:
Viés HTF (H2): BaixistaMudança HTF (H2): 25/11 08:00 @1.09200
Você também pode ativar um alerta sonoro quando o viés do período principal mudar.
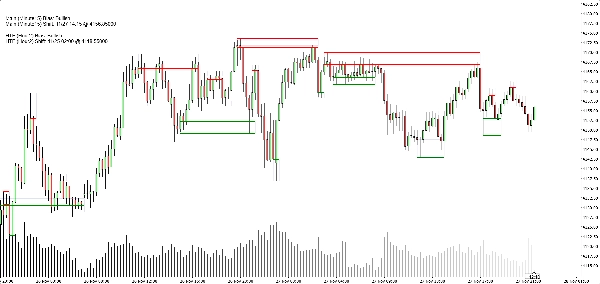
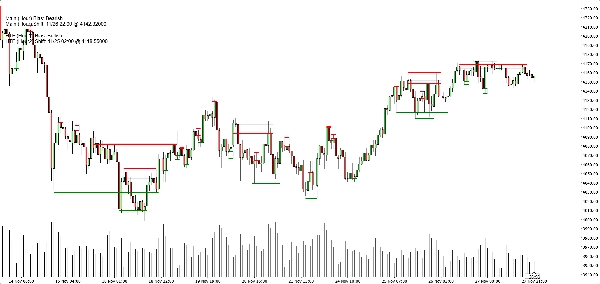
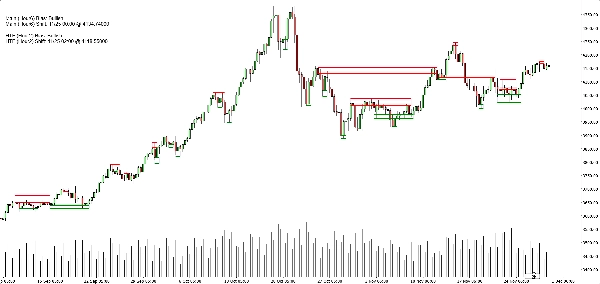
O que você vê no gráfico
- Zonas de suporte:
-
- Linhas horizontais verdes base/gatilho (opcional),
- Um retângulo azul-marinho suave (opacidade muito baixa) mostrando toda a faixa de suporte.
- Zonas de resistência:
-
- Linhas vermelhas + retângulo azul-marinho suave para a faixa.
- Alternâncias de exibição limpa:
-
- Mostrar/ocultar zonas de suporte,
- Mostrar/ocultar zonas de resistência,
- Ligar/desligar os retângulos preenchidos,
- Ligar/desligar as linhas base/gatilho,
- Ligar/desligar o painel de viés.
Isso permite que diferentes traders escolham entre:
- Um visual mais minimalista (talvez apenas retângulos), ou
- Uma visão mais precisa (linhas exatas visíveis).
Casos típicos de uso
Você pode posicioná-lo como útil para:
- Filtragem de tendência
-
- Só procurar compras quando ambos os viéses do TF principal e HTF forem Altistas.
- Só procurar vendas quando ambos forem Baixistas.
- Entradas em zona
-
- Usar as zonas como áreas de interesse para:
-
- Ordens limitadas,
- Entradas de confirmação (ex: preço retorna a uma zona rompida e rejeita novamente),
- Colocação de stop logo além da faixa externa.
- Análise de cima para baixo
-
- Viés HTF (H2 por padrão) como o panorama geral,
- Viés do TF do gráfico para o timing,
- Zonas para níveis concretos de execução.
O que ele NÃO é (importante para venda honesta)
- Ele não é um robô que negocia automaticamente para você.
- Ele não é um sinal “santo graal” que garante lucro.
- É um motor de estrutura e viés:
-
- Define zonas objetivamente,
- Define tendência/viés objetivamente com base nessas zonas,
- Deixa a gestão real da negociação para o trader/estratégia.
Resumo
It provides a rule-based bullish or bearish bias by tracking price breaks above resistance or below support zones on both the current chart timeframe and an optional higher timeframe. This bias is displayed on a built-in dashboard panel, with optional sound alerts for bias changes.
The indicator works across all timeframes and markets where price forms swings, including forex, crypto, stocks, and futures. It features customizable lookback periods, automatic cleanup of old zones, and toggles for display elements to suit different trader preferences.
Typical uses include trend filtering by aligning biases across timeframes, identifying zone entries for limit or confirmation orders, and supporting top-down analysis. The tool timestamps and sequences pivots and bias shifts, facilitating automation or journaling. It is a structure and bias engine that aids traders in objectively defining market levels and trends while maintaining chart clarity.
Avaliações de clientes
5 | 33 % | |
4 | 67 % | |
3 | 0 % | |
2 | 0 % | |
1 | 0 % |