
说明
会话成交量剖面高清版
功能介绍
直接在图表上显示每个交易会话的横向成交量剖面。它展示了成交量如何分布在不同价格水平,帮助交易者识别高活跃区、公允价值区以及纯粹基于成交量行为得出的关键支撑/阻力位。
工作原理
每根新K线收盘时,指标扫描定义的会话数量内的所有K线,并将每根K线的成交量分布到其价格区间内。成交量根据K线的开盘/收盘方向作为代理,分为买方(多头K线)和卖方(空头K线)。结果以分层横向直方图形式呈现,锚定于会话的时间边界。
视觉元素
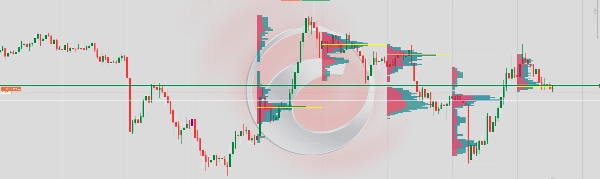
买方柱(青色) — 显示每个价格水平上多头价格变动的成交量。从会话锚点向左(或翻转时向右)增长。
卖方柱(红色) — 显示每个价格水平上空头价格变动的成交量,与买方柱并排堆叠。
POC线(黄色) — 控制点。标记会话中总成交量最高的价格水平的横线。对价格具有吸引作用。
价值区(蓝色覆盖) — 包含会话总成交量可配置百分比(默认70%)的价格区间。代表大部分交易发生的“公允价值”区域。
会话高低线(白色虚线) — 标记会话期间达到的最高价和最低价。
性能表现
指标仅在每根新K线时重绘一次,而非每个tick都重绘。这消除了闪烁现象,即使在多会话和高价格水平数量下也能保证稳定渲染。
限制
由于cTrader在无tick数据源时无法在K线级别暴露真实买卖盘成交量,买卖成交量通过近似计算:多头K线按65%买入/35%卖出权重,空头K线相反,多头十字星K线则均分50/50。若需真实的delta成交量,则需订阅tick数据。
摘要
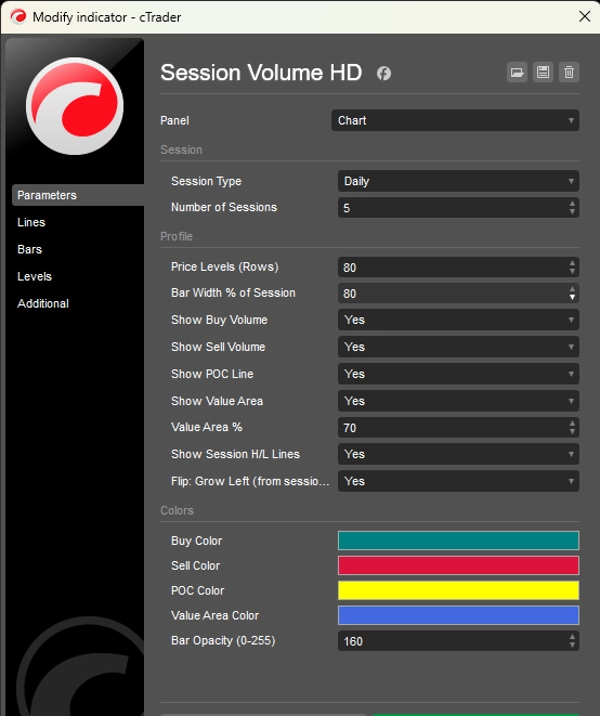
指标配置
客户评价
0.0
评价:0
客户评价
该产品尚无评价。已经试过了?抢先告诉其他人!
讨论
常见问答
BTCUSD
Forex
Signal
Breakout
Indices
EURUSD
Commodities
GBPUSD
NZDUSD
Martingale
Prop
Scalping
Fair Value Gap
SMC
Crypto
Grid
Stocks
AI
XAUUSD
NAS100
USDJPY
VWAP
cTrader Store 提供的所有产品,包括交易机器人、指标和插件,均由第三方开发者提供,仅供信息参考和技术访问之用。cTrader Store 并非经纪商,不提供投资建议、个人推荐或任何未来业绩保证。
该作者的其他作品


猜您喜欢


价格
注册日期 15/01/2025
7
销售