
WVAP-Bands Indicator_noSourceCode
指标
1 购买
版本 1.0, Sep 2025
Windows 版、Mac 版
4.5
评价:2
说明
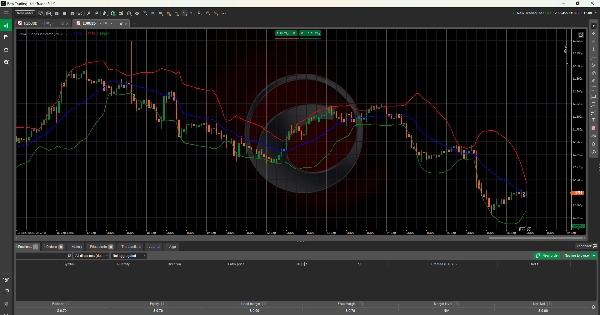
VWAP 带 - 专业成交量分析
用机构级精度改变您的交易方式
VWAP 带指标提供专业的成交量加权价格分析,配备动态标准差带。全球机构交易者用它来识别最佳进出场点。
🚀 主要特点
- 真实 VWAP 计算:使用 HLC/3 方法的成交量加权平均价格
- 动态带:基于成交量加权标准差的上下轨带
- 完全自定义:可调节周期、颜色和带宽乘数
- 实时分析:每根K线更新,提供即时市场洞察
📊 交易应用
- 超买/超卖:上轨=卖出信号,下轨=买入信号
- 动态支撑/阻力:VWAP 作为机构参考水平
- 均值回归:价格延伸至带极端时的交易反转
- 趋势确认:穿越带的强势突破预示趋势延续
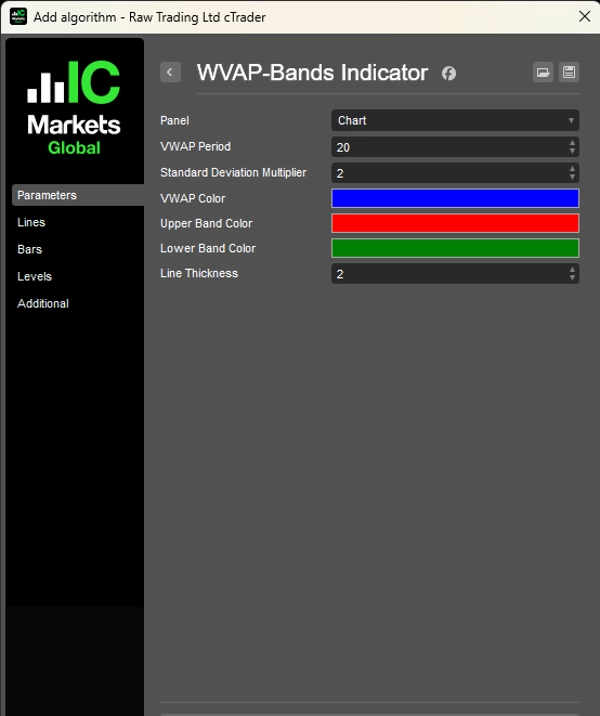
⚙️ 专业设置
- VWAP 周期:1-200根K线(默认:20)
- 标准差:0.1-5.0倍数(默认:2.0)
- 视觉自定义:自定义颜色和线条粗细
- 多时间框架:适用于所有时间框架和交易品种
✅ 为什么选择 VWAP 带?
优于简单移动平均线,VWAP 带提供:
- 成交量加权的准确性,实现真正的机构分析
- 自适应波动性带,能根据市场状况调整
- 专业方法论,全球成功交易者采用
- 通用应用,涵盖外汇、股票、加密货币和商品
非常适合寻求专业成交量分析的剥头皮交易者、日内交易者和波段交易者。
兼容 cTrader 4.0+。适用于所有交易品种和时间框架。
摘要
AI 摘要
The WVAP-Bands Indicator provides volume-weighted average price (VWAP) analysis enhanced with dynamic standard deviation bands. It calculates VWAP using the HLC/3 price method and overlays upper and lower bands based on volume-weighted standard deviation, offering adaptive volatility measures. The indicator supports full customization of periods, colors, and band width multipliers, allowing traders to tailor it to their strategies. It updates in real time with each new bar, delivering immediate market insights.
Key trading applications include identifying overbought and oversold conditions (upper band signals sell, lower band signals buy), dynamic support and resistance levels with VWAP as an institutional reference, mean reversion opportunities when prices reach band extremes, and trend confirmation through breakouts beyond the bands. Settings allow adjustment of VWAP period (1–200 bars), standard deviation multiplier (0.1–5.0), and visual elements such as colors and line thickness.
The indicator is compatible with all timeframes and instruments, including forex, stocks, cryptocurrencies, commodities, and indices. It is designed for scalpers, day traders, and swing traders seeking professional-grade volume analysis and is compatible with cTrader 4.0 and above.
指标配置
客户评价
4.5
评价:2
5 | 50 % | |
4 | 50 % | |
3 | 0 % | |
2 | 0 % | |
1 | 0 % |
客户评价
October 4, 2025
The sample size matters. The useful metric is POC and VWAP first, compare the result with 20 reactions, and only scale if 2 sessions still looks controlled.
October 3, 2025
I liked it more as a extra filter for volume based context than as something to follow blindly. Pressure is easier to read, and the final decision still feels like it belongs to the trader. The next review on it on value area.
讨论
常见问答
BTCUSD
Forex
Signal
Breakout
Indices
EURUSD
Commodities
GBPUSD
NZDUSD
Prop
Scalping
Crypto
Stocks
XAUUSD
NAS100
USDJPY
VWAP
cTrader Store 提供的所有产品,包括交易机器人、指标和插件,均由第三方开发者提供,仅供信息参考和技术访问之用。cTrader Store 并非经纪商,不提供投资建议、个人推荐或任何未来业绩保证。
该作者的其他作品


猜您喜欢


价格
注册日期 15/01/2025
7
销售