
Area of Interest
Индикатор
2 покупки
Версия 1.0, Aug 2025
Windows, Mac
4.0
Отзывы: 2
Описание
1. Цель индикатора
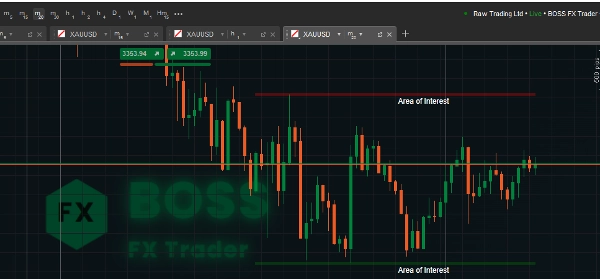
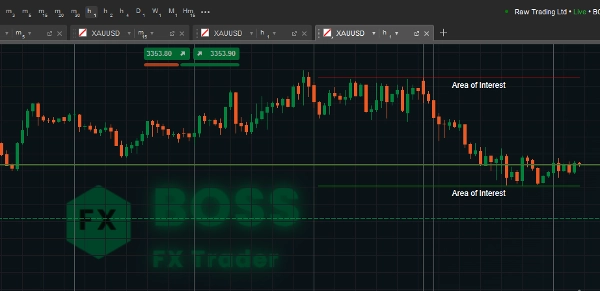
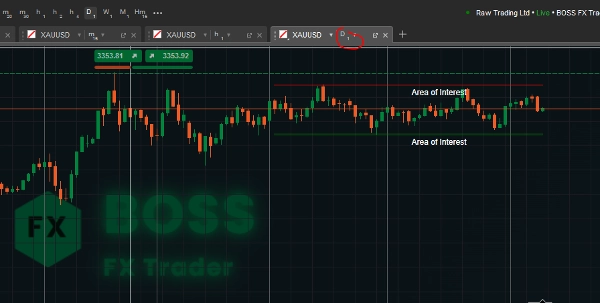
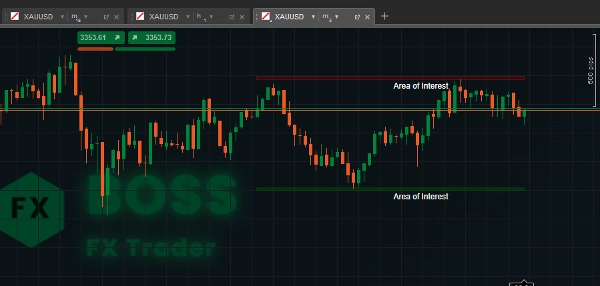
Этот индикатор Area of Interest для cTrader определяет зоны поддержки и сопротивления в пределах заданного пользователем периода просмотра и визуально выделяет их как «Зоны интереса» на вашем графике.
Он помогает трейдерам быстро видеть ключевые уровни цен, где вероятнее всего произойдут развороты или пробои.
2. Как работает код
- Период просмотра – количество предыдущих баров (свечей), которые индикатор просматривает для поиска максимума и минимума.
- Большие значения → более широкие зоны.
- Малые значения → более свежие уровни.
- Высота зоны – вертикальный размер (толщина) зоны поддержки/сопротивления в пунктах.
- Помогает сделать зону более заметной и регулируемой.
- Очищает старые рисунки перед нанесением новых, чтобы избежать загромождения.
- Собирает максимальные и минимальные цены за период просмотра.
- Находит максимальные и минимальные уровни цен (сопротивление и поддержка).
- Преобразует высоту зоны из пунктов в фактическое значение цены.
3. Инструкции по использованию
- Подключите индикатор
-
- Откройте cTrader, загрузите график, нажмите Indicators → Custom → AreaOfInterest.
- Настройте параметры
-
- Период просмотра:
-
- Для свинг-трейдинга → используйте большие значения (например, 100–200).
- Для скальпинга → используйте меньшие значения (например, 20–50).
- Высота зоны: настройте под ваш стиль торговли и волатильность инструмента.
- Интерпретация зон
-
- Красная зона (сопротивление) – цена склонна к развороту или замедлению при входе в эту зону.
- Зеленая зона (поддержка) – цена часто отскакивает вверх отсюда.
- Обратите внимание на:
-
- отторжение цены
- свечные модели (пин-бары, поглощения)
- совпадение с другими индикаторами (EMA, RSI, Фибоначчи)
- Примеры торговли
-
- Торговля от отскока: входите в лонг возле зеленой зоны с установкой стопа чуть ниже.
- Торговля на пробой: ждите закрытия цены выше красной зоны для бычьего пробоя.
- Обнаружение ложного пробоя: следите за хвостами за пределами зоны, но закрытием внутри (возможные развороты).
Этот инструмент использовал прибыльный трейдер.
Сводка
ИИ-сводка
Area of Interest is a cTrader indicator designed to identify and visually highlight key support and resistance zones on trading charts. It scans a user-defined lookback period to detect the highest highs and lowest lows, marking these as “Areas of Interest” to help traders recognize price levels where reversals or breakouts are more likely. Users can adjust the lookback period to focus on broader historical zones or more recent price levels, and set the vertical size (zone height) of these areas in pips for better visibility. The indicator clears previous drawings before plotting new zones to maintain chart clarity. Resistance zones are displayed in red, indicating potential price reversals or slowdowns, while support zones appear in green, suggesting possible price bounces. Traders can use these zones alongside price action signals such as candlestick patterns and other technical indicators to inform trading decisions. Typical applications include entering long positions near support zones, trading breakouts above resistance zones, and detecting false breakouts by observing price wicks relative to the zones. The indicator supports customization to suit different trading styles, including scalping and swing trading, by adjusting the lookback period and zone height parameters.
Профиль индикатора
Отзывы покупателей
4.0
Отзывы: 2
5 | 0 % | |
4 | 100 % | |
3 | 0 % | |
2 | 0 % | |
1 | 0 % |
Обсуждение
Частые вопросы
Продукты, доступные в cTrader Store, включая торговых ботов, индикаторы и плагины, предоставляются сторонними разработчиками и доступны исключительно в информационных и технических целях. cTrader Store не является брокером и не предоставляет инвестиционные консультации, персональные рекомендации или какие-либо гарантии будущей доходности.


Цена
С 29/05/2025
3.04M
Торгуемый объем
45.22K
Выигранные пипы
29
Продажи
769
Бесплатные установки