

Fixed Range Volume Profile Auto-last swing move
指标
版本 1.0, Jul 2026
Windows 版、Mac 版
Trading product for Fixed Range Volume Profile  Auto-last swing move 指标 Fibonacci Key Levels, image 2
Trading product for Fixed Range Volume Profile  Auto-last swing move 指标 Fibonacci Key Levels, image 3
Trading product for Fixed Range Volume Profile  Auto-last swing move 指标 Fibonacci Key Levels, image 4
注册日期 14/01/2025
1
销售
123
免费安装

说明

SWING VOLUME PROFILE (SVP)

Swing-Based Volume Profile + Fibonacci + RSI


--------------------------------------------------


Swing detection. Volume profile. Fibonacci. RSI. All-in-one.


--------------------------------------------------


WHAT THIS INDICATOR DOES


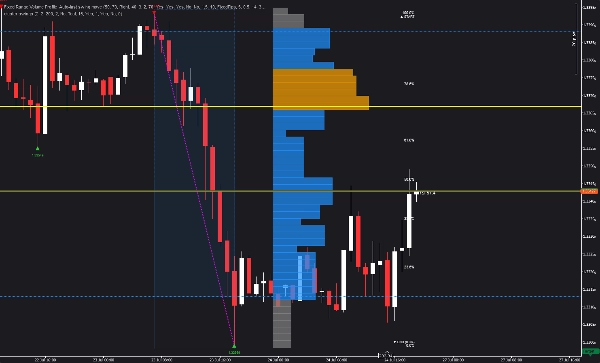
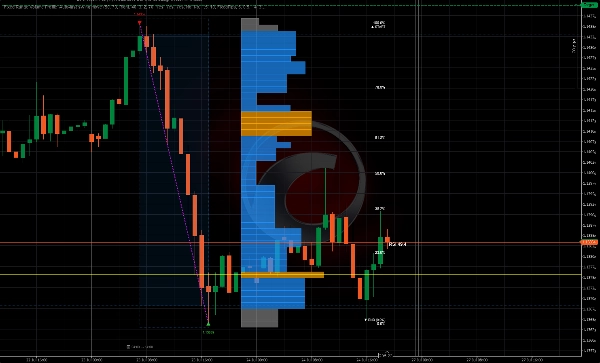
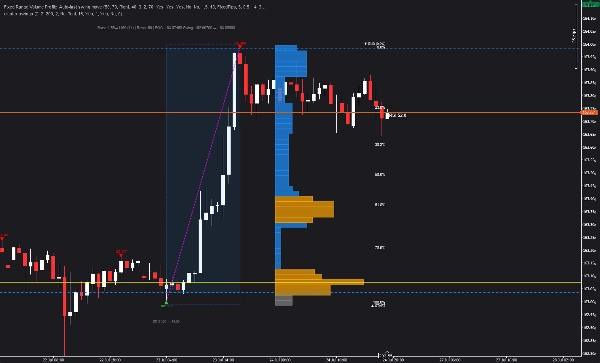
Swing Volume Profile (SVP) automatically detects structural swings and displays a volume profile for the most recent completed swing — with Fibonacci retracement and RSI overlay.


No manual range selection needed. The indicator finds the swings and builds the profile automatically.


--------------------------------------------------


KEY FEATURES


- AUTO-SWING DETECTION (configurable depth and deviation)

- Volume Profile for the last completed swing

- Point of Control (POC) - highest volume level

- Value Area (VAH + VAL) - configurable percentage

- High Volume Nodes (HVN) - volume above average threshold

- Fibonacci Retracement (0, 23.6, 38.2, 50, 61.8, 78.6, 100)

- RSI Overlay near current price

- Histogram positioning: Left, Right, or Near Bars

- Configurable rows (10 to 200)

- Customizable colors and opacity

- Extend lines to the right

- Show/hide price labels

- No repainting


--------------------------------------------------


HOW IT WORKS


1. The indicator detects swings using configurable depth and deviation

2. The last completed swing is identified

3. Volume profile is calculated from the swing range

4. POC, VAH, VAL, HVN are displayed

5. Fibonacci retracement is overlaid on the swing

6. Current RSI is displayed near price


All automatic. No manual input required.


--------------------------------------------------


VISUAL ELEMENTS


- Red down triangles = Swing highs

- Green up triangles = Swing lows

- Magenta dotted line = Swing connection

- Yellow horizontal line = Point of Control (POC)

- Blue dashed lines = Value Area High (VAH) and Value Area Low (VAL)

- Orange bars = High Volume Nodes (HVN)

- Gray bars = Low volume nodes

- Gold horizontal lines = Fibonacci levels

- White labels = Fibonacci percentages

- RSI value = Current RSI near price


--------------------------------------------------


PARAMETER OVERVIEW


PROFILE SETTINGS:

- Number of Rows: How many price rows (10-200)

- Value Area Percentage: % of volume in value area (1-100)


VISUAL SETTINGS:

- Histogram Position: Right, Left, Near Bars, or Near Bars Left

- Histogram Width %: Width of histogram bars

- Bar Width Scaling: Scaling factor for bar widths

- Min Bar Width %: Minimum bar width

- Bar Opacity: Transparency of bars (10-100)


SWING DETECTION:

- Swing Depth: How many bars to check for local extrema

- Deviation Mode: Fixed Pips or ATR-Based

- Fixed Deviation: Minimum pip distance between swings

- ATR Deviation Multiplier: Multiplier for ATR-based deviation

- ATR Period: Period for ATR calculation

- Backstep: Minimum bars between swings


VISUAL - SWINGS:

- Show Swing Lines: Toggle magenta swing line

- Swing Line Color

- Show Swing Labels: Toggle price labels

- High/Low Swing Colors


VISUAL - FIBONACCI:

- Show Fib Retracement: Toggle Fibonacci overlay

- Show Fib Lines: Toggle horizontal lines

- Show Fib Labels: Toggle percentage labels

- Fib Line Color / Fib Text Color


VISUAL - RSI:

- Show RSI Value: Toggle RSI overlay

- RSI Period: Period for RSI calculation

- RSI Label Color


COLORS:

- POC Color / Value Area Color / High Volume Node Color / Low Volume Color


--------------------------------------------------


USE CASES


- Identify swings and volume distribution in one view

- Find Point of Control (POC) for entries and exits

- Use Value Area (VAH/VAL) for profit targets

- Spot High Volume Nodes (HVN) for key levels

- Apply Fibonacci retracement to the swing

- Confirm trades with RSI confluence

- Understand volume distribution at a glance


--------------------------------------------------


UPGRADE TO STRUCTURAL HEAT ZONES


This indicator shows you swings and volume distribution.


Structural Heat Zones takes it further — it maps participation intensity, acceptance vs rejection, and market engagement across multiple zones.


Search for Structural Heat Zones in the cTrader Store.


--------------------------------------------------


UPGRADE TO INVICTUS EA


Invictus EA uses structural technology to execute automated trades.


Search for Invictus in the cTrader Store.


--------------------------------------------------


TECHNICAL NOTES


- Overlay indicator

- Works on any timeframe and symbol

- No repainting (historical calculation)

- Optimized for performance


--------------------------------------------------


SUPPORT


Lifetime updates included.


FOR MORE INFORMATION - Click Developer's Profile below.

摘要

指标配置
指标分类
波动性
输出类型
可视化
数据要求
仅 K 线
跳动点数据
支持的信号
交叉
背离
突破
反转
趋势强度
波动性
触及水平位
突破水平位
时段开盘区间

客户评价

0.0
评价:0
客户评价
该产品尚无评价。已经试过了?抢先告诉其他人!

讨论

常见问答

Fibonacci
Key Levels
RSI
Volume
Support & Resistance
cTrader Store 提供的所有产品,包括交易机器人、指标和插件,均由第三方开发者提供,仅供信息参考和技术访问之用。cTrader Store 并非经纪商,不提供投资建议、个人推荐或任何未来业绩保证。

该作者的其他作品

指标
ATR
RSI
+5
Free swing detector with Fibonacci retracement and RSI overlay. Auto-deviation adapts to any timeframe
cBot
ATR
Wedge
+5
15 YEARS RESULTS :Win rate:93% | ROI+19000% | Trades:87,000 | Profit Factor 1.2 | Currency Pairs:22 | $10k to 500k$ |
1.2
盈利系数
指标
ATR
BOS
+5
Heat intensity mapping of structural participation. See where price fights, where it accepts, and where it rejects .
指标
Volume
Imbalance
+1
Volume profile indicator that auto-detects the latest trendline. Shows POC, Value Area (VAH/VAL), and High Volume Nodes

猜您喜欢

指标
ATR
RSI
+24
Daily moving averages, simplified. Displays 3 daily moving averages on lower timeframes with selectable MA types.
指标
Key Levels
Support & Resistance
Professional Opening Range Breakout indicator with live ORB levels and breakout detection.
指标
Customizable window inside your platform, access to any website Calendar
指标
CHOCH
Fair Value Gap
+2
Advanced FVG & IFVG indicator with multi-timeframe confluence, CHoCH filtering, and smart mitigation.
指标
EMA
RSI
+5
MACD Colour Histogram with 11 Moving Average Types, Multi-timeframe confirmation and Sound Signal Alert.
指标
EMA
SMA
+3
Display up to 10 customizable moving averages and optional VWAP in one powerful indicator.
指标
SMC
BTCUSD
+9
Detects CHoCH breakouts, draws interest zones & auto Fibo. Built for Smart Money & Price Action Engulfing confirmation
指标
Aggressive
Supertrend
+5
Stop trading with tunnel vision! 🚫 The Heat Map Dashboard is an institutional-grade visual trading assistant
指标
Overlay HTF context on any chart: color bars by HTF and draw filled HTF bodies with optional High/Low lines.
指标
AI
SMC
+11
Perfect Entry Price designed to help traders identify the most accurate and reliable price levels for market entries
指标
EMA
Channel
+5
⚡ CoreQuant Trend Engine: Multi-timeframe EMA crosses, pullback rejections, trend cloud & live radar dashboard
指标
ATR
Forex
+2
Trade fearlessly: auto-adjusts order blocks, manages risks, and ensures precision. Was Free for early users now -80%
指标
ATR
Prop
+4
Supertrend Indicator for cTrader
指标
Signal
Breakout
+1
Bolliger Bands + Hamster-Coder™ Timeframe Decoupling
指标
AI
Prop
+9
Phoenix Zones - Detector de Reversiones Críticas
指标
Key Levels
Order Block
+2
It monitors trend lines on price charts and fires multi-channel alerts and optionally places trades when price crosses..
指标
Three ZigZag lines
指标
Forex
Crypto
+4
Auto Trend Line Indicator for cTrader

价格

注册日期 14/01/2025
1
销售
123
免费安装




























