
说明
布林带高级挤压与突破系统
布林带指标是波动率交易者的基础工具,但标准的布林带缺少关键的背景信息:市场是否在挤压?趋势是否足够强劲以跟随?行情是否过度延伸?
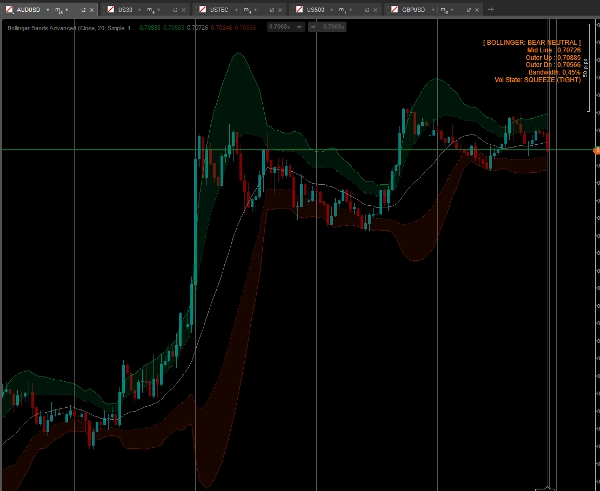
该 布林高级 指标将标准布林带转变为高度可视化的专业级交易系统。通过引入双动作区(云层)、自动波动率挤压检测器和智能彩色柱,它为您捕捉爆发性突破和精准时机的均值回归入场提供了巨大优势。
主要功能
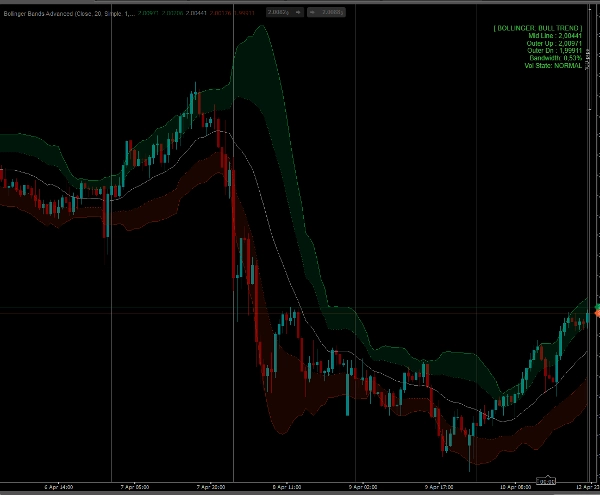
- 双带云系统(动作区): 该指标绘制了一个内带(例如,1标准差)和一个外带(例如,2标准差),而非单一外带。两者之间的空间被阴影覆盖形成云层。
-
- 价格在云层内?您处于“趋势区”。顺势而为!
- 价格在中线和内带之间?您处于“中性区”。等待合适的交易信号。
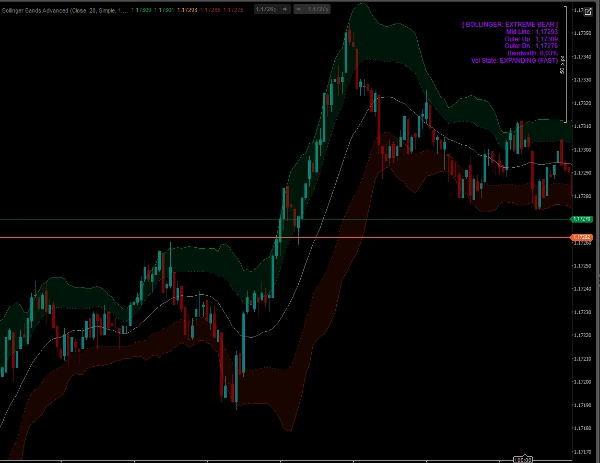
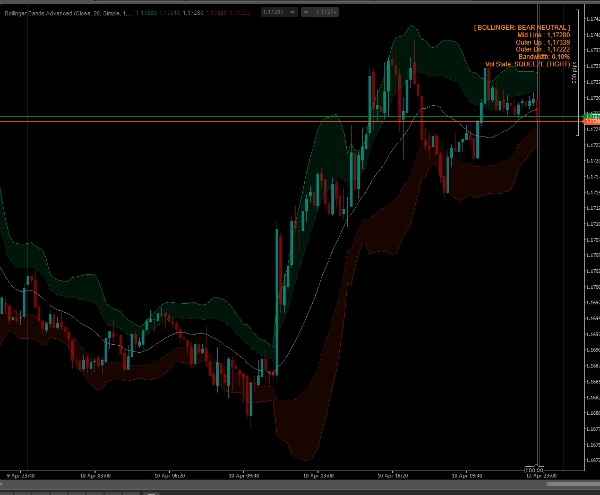
- 自动挤压检测器: 指标持续计算布林带宽度并与历史移动平均线比较。当带宽异常收缩时,图表上的仪表盘会闪烁明亮的橙色 “挤压(紧缩)” 警报,提醒您即将发生爆发性突破!
- 智能柱颜色(彩色柱): 根据波动率和带的位置,您的蜡烛图颜色会发生变化:
-
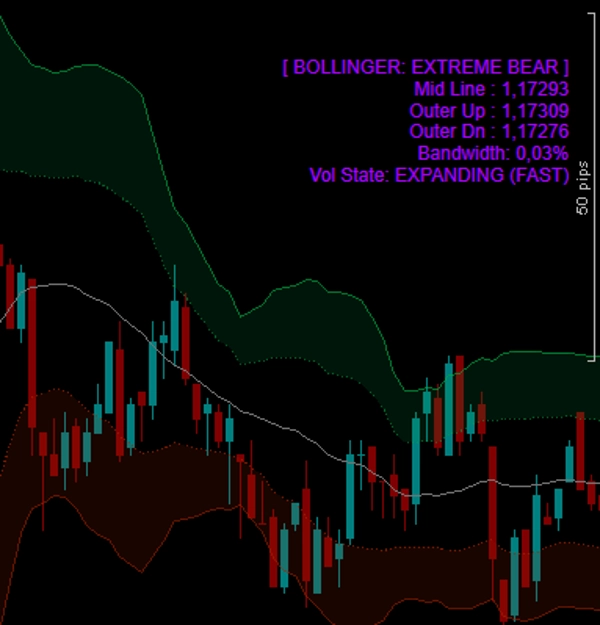
- 霓虹紫/品红(极端):价格收盘于外带之外。表明大规模突破或过度延伸的高潮。
- 亮绿/红(趋势):价格积极推动进入云层动作区。
- 暗绿/红(中性):价格回撤向移动平均线靠拢。
- 实时图表仪表盘: 一个简洁的面板显示精确的带水平、当前带宽百分比、市场状态和波动率状态(挤压、正常或扩张)。
- 完全解锁: 可在任何符号(外汇、加密货币、指数、股票)和任何时间框架上交易,无任何限制。终身访问权限。
如何使用它进行交易?
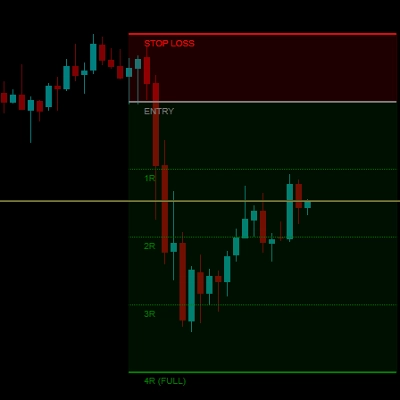
- 突破(挤压玩法): 查看仪表盘。当波动率状态显示“挤压”时,市场正在积蓄能量。等待蜡烛突破云层区域并变为亮绿/红色。这是您进入高动量突破的信号。
- 趋势跟随: 只要蜡烛保持亮绿/红色并紧贴云层外侧,就继续持有交易。
- 均值回归: 当长期趋势将价格完全推至外带之外(蜡烛变紫色)且仪表盘显示“快速扩张”时,市场被过度拉伸。寻找价格反转回中线的交易机会。
摘要
指标配置
指标分类
波动性
输出类型
信号
可视化
过滤器
数据要求
仅 K 线
支持的信号
突破
趋势强度
波动性
客户评价
4.0
评价:2
5 | 0 % | |
4 | 100 % | |
3 | 0 % | |
2 | 0 % | |
1 | 0 % |
客户评价
April 20, 2026
demo first, then maybe small size if the notes look sane. The setup needs patience.
April 18, 2026
讨论
常见问答
Bollinger Bands
Channel
ATR
cTrader Store 提供的所有产品,包括交易机器人、指标和插件,均由第三方开发者提供,仅供信息参考和技术访问之用。cTrader Store 并非经纪商,不提供投资建议、个人推荐或任何未来业绩保证。


猜您喜欢


价格
24
销售
710
免费安装