
说明
每周和每日开盘缺口 — NWOG 和 NDOG 指标
面向机构交易者和严肃散户参与者的专业级开盘缺口可视化工具
概述
每周和每日开盘缺口(NWOG 和 NDOG)是一款精确的指标,专为将开盘缺口分析作为交易方法一部分的交易者设计——包括 ICT、智能资金概念和机构流动策略。
该指标自动检测、绘制并管理新周开盘缺口(NWOG)和新日开盘缺口(NDOG),直接显示在您的图表上。每个缺口均以清晰可见的价格区域呈现,颜色、透明度、标签和延伸行为均可完全自定义。
采用模块化、性能优化的架构构建,该指标能够处理大量历史数据而不会降低平台速度——同样适用于回测和实时交易。
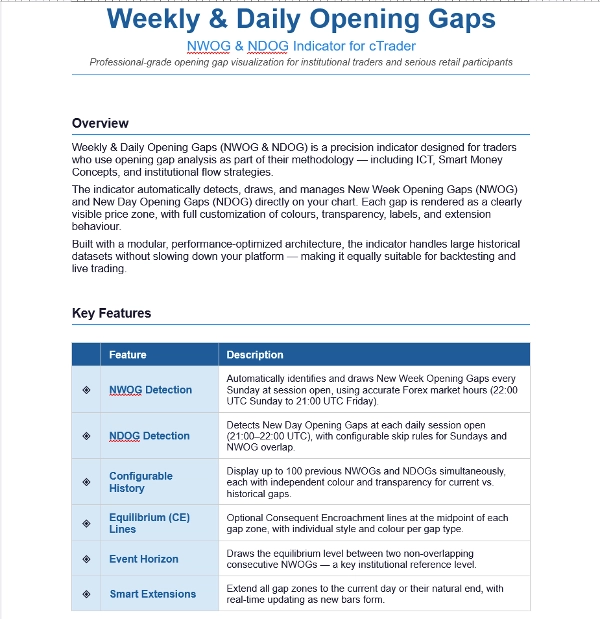
主要功能
◈ NWOG 检测
◈ NDOG 检测,带有可配置的跳过规则,适用于周日和 NWOG 重叠情况。
◈ 可配置历史记录 — 显示最多 100 个之前的 NWOG
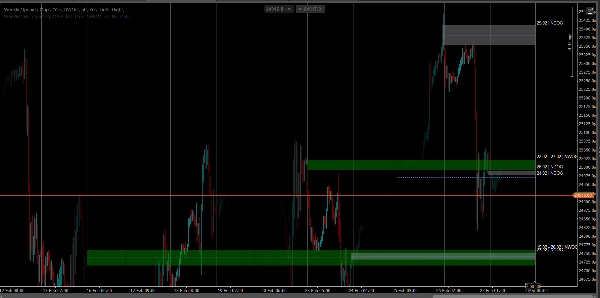
◈ 平衡线(CE)
◈ 事件视界 — 绘制两个不重叠连续 NWOG 之间的平衡水平
◈ 智能延伸 — 将所有缺口区域延伸至当前日或其自然结束,并随着新柱形成实时更新。
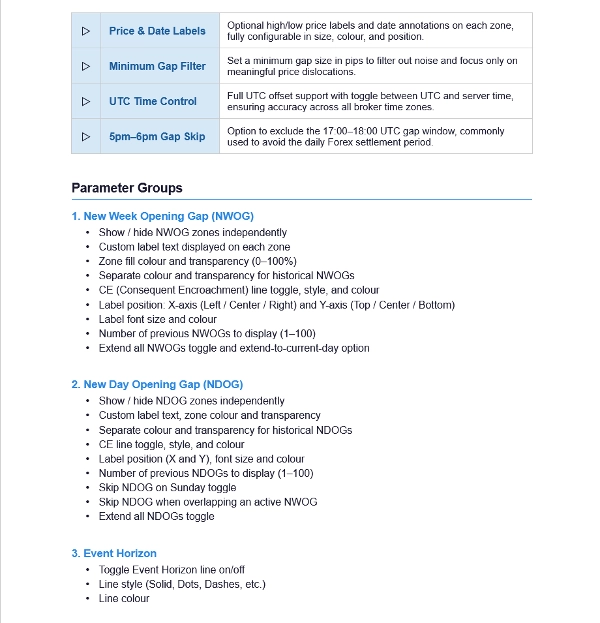
◈ 价格和日期标签
◈ 最小缺口过滤器
◈ UTC 时间控制
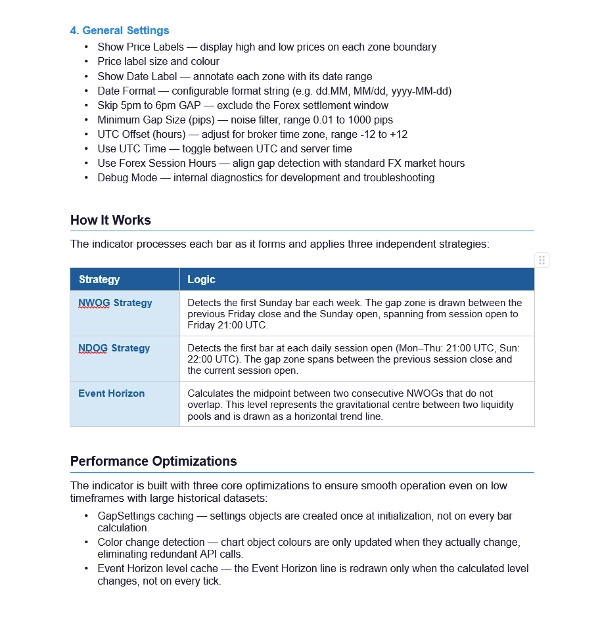
工作原理
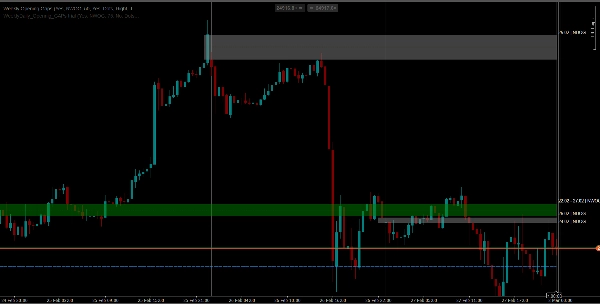
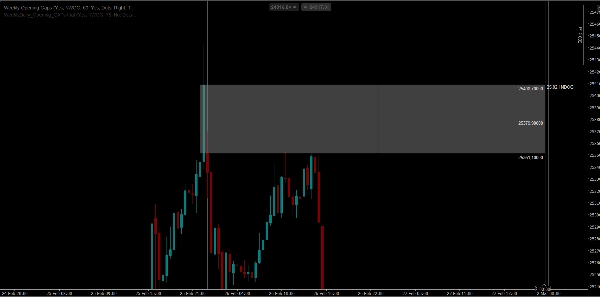
NWOG 策略 — 检测每周的第一个周日柱。缺口区域绘制在前一个周五收盘价和周日开盘价之间,时间跨度从开盘时段到周五 21:00 UTC。
NDOG 策略 — 检测每日开盘时段的第一个柱(周一至周四:21:00 UTC,周日:22:00 UTC)。缺口区域跨越前一时段收盘价和当前时段开盘价之间。
事件视界 — 计算两个不重叠连续 NWOG 之间的中点。该水平代表两个流动性池之间的引力中心,并以水平趋势线绘制。
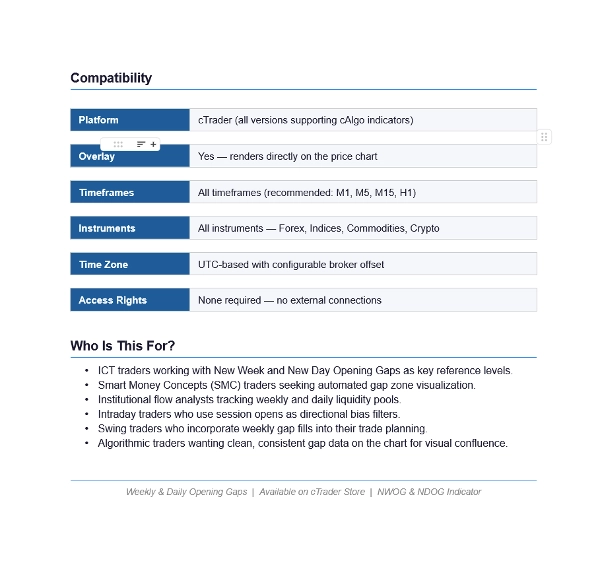
兼容性
平台:cTrader(支持 cAlgo 指标的所有版本)
叠加:是 — 直接渲染在价格图表上
时间框架:所有时间框架(推荐:M1、M5、M15、H1)
工具:所有 — 外汇、指数、商品、C
适用对象
使用新周和新日开盘缺口作为关键参考水平的 ICT 交易者
寻求自动化缺口区域可视化的智能资金概念(SMC)交易者
追踪每周和每日流动性池的机构流动分析师
使用时段开盘作为方向偏好过滤器的日内交易者
将每周缺口回补纳入交易计划的波段交易者
希望在图表上获得干净、一致缺口数据以实现视觉汇聚的算法交易者
摘要
客户评价
5 | 0 % | |
4 | 100 % | |
3 | 0 % | |
2 | 0 % | |
1 | 0 % |


