Mô tả
HCCC MTF - Kênh Hợp Thành Chu Kỳ Hurst (100% MIỄN PHÍ)
Tổng quan
Công cụ HCCC MTF (Kênh Hợp Thành Chu Kỳ Hurst) là một bảng điều khiển và chỉ báo kênh đa khung thời gian (MTF) tiên tiến, hoàn toàn tương tác. Dựa trên lý thuyết chu kỳ của J.M. Hurst kết hợp với biến động ATR, công cụ này giúp bạn xác định xu hướng thị trường thực sự và các điểm quay chu kỳ hoàn hảo (đỉnh và đáy) trên nhiều khung thời gian cùng lúc.
Công cụ thứ hai dành riêng cho giao dịch bán tự động với https://ctrader.com/products/3618?u=cLogic
QUAN TRỌNG: Chỉ báo này hoàn toàn 100% MIỄN PHÍ cho mọi người. Nó được phát triển đặc biệt như một công cụ hỗ trợ trực quan tối ưu cho cBot "Follow The Trend XAU Edition".
Mặc dù bạn có thể sử dụng nó hoàn hảo cho giao dịch thủ công, sức mạnh thực sự của nó được khai thác khi sử dụng trong thiết lập bán tự động: Bạn sử dụng Bảng điều khiển HCCC để đọc chu kỳ và động lượng trên khung thời gian cao hơn, sau đó kích hoạt cBot Follow The Trend XAU Edition để thực hiện và quản lý các giao dịch chính xác theo hướng đó.
Các tính năng chính
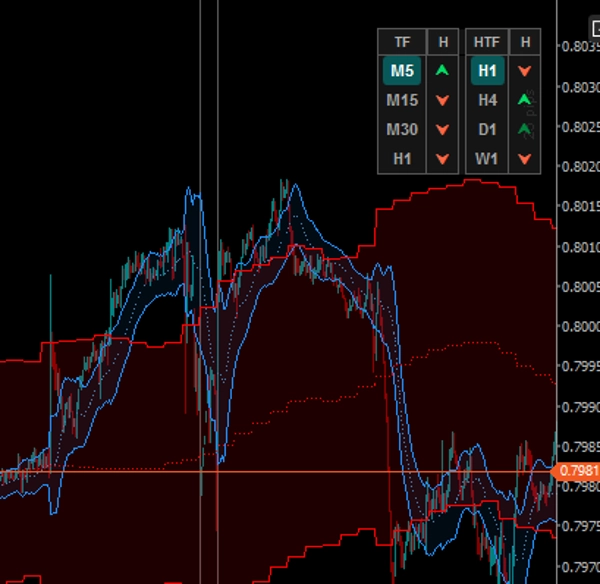
1. Bảng điều khiển MTF tương tác (Có thể nhấp)
Quên việc chuyển đổi qua lại giữa các biểu đồ. Bảng điều khiển trên biểu đồ theo dõi 4 Khung Thời Gian Thấp (LTF) và 4 Khung Thời Gian Cao (HTF).
- Nút LTF: Nhấp vào bất kỳ nút LTF nào để thay đổi ngay khung thời gian biểu đồ hiện tại của bạn.
- Nút HTF: Nhấp vào bất kỳ nút HTF nào để chiếu trực tiếp kênh của Khung Thời Gian Cao đó lên biểu đồ hiện tại của bạn!
2. Hệ thống phủ kênh kép
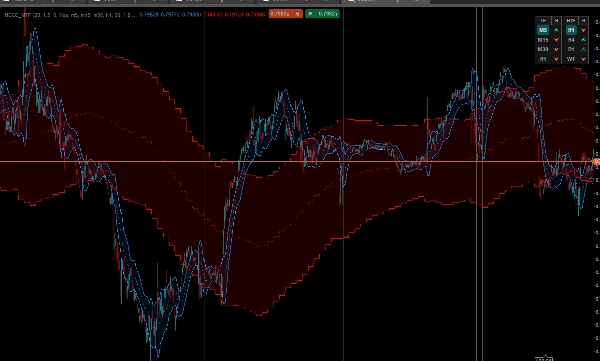
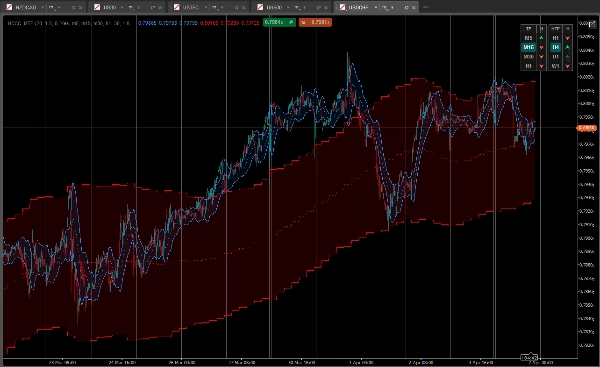
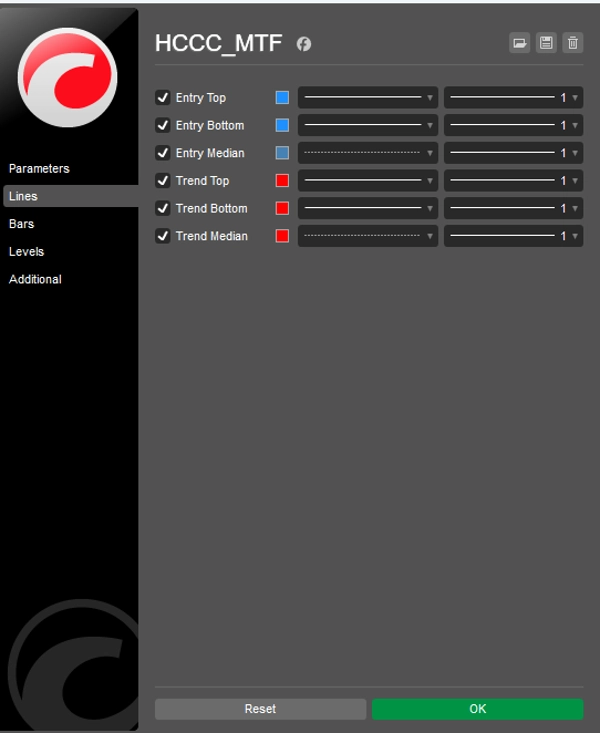
Chỉ báo vẽ hai kênh đẹp mắt, có đám mây phủ trên biểu đồ của bạn cùng lúc:
- Chu kỳ vào lệnh (Đám mây xanh): Tính toán chu kỳ Hurst dựa trên khung thời gian biểu đồ hiện tại của bạn.
- Chu kỳ xu hướng (Đám mây đỏ): Kênh nhìn tổng quan được tính toán từ Khung Thời Gian Cao bạn chọn trong bảng điều khiển.
3. Tín hiệu chu kỳ 5 trạng thái nâng cao
Bảng điều khiển không chỉ hiển thị hướng xu hướng; nó còn cho thấy pha của chu kỳ bằng cách phân tích độ dốc của đường trung bình và vị trí giá so với các dải ATR.
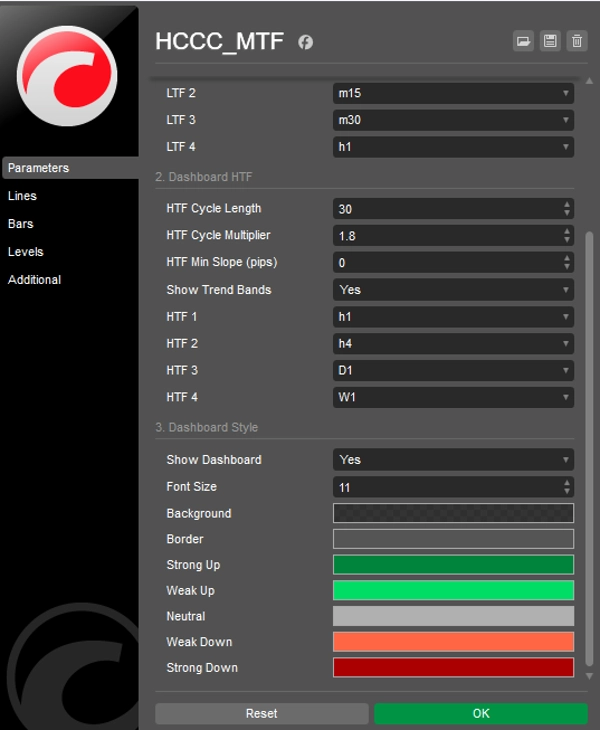
- [ ⮝ ] Xanh đậm (Mua mạnh): Độ dốc trung bình đang lên, và giá đã giảm xuống dải dưới. Đây là đáy chu kỳ (mua khi giá giảm).
- [ ⮝ ] Xanh nhạt (Mua yếu): Xu hướng đang lên, nhưng giá đang dao động quanh đường trung bình hoặc dải trên.
- [ — ] Xám (Trung tính): Chu kỳ đang phẳng. Không có động lượng rõ ràng.
- [ ⮟ ] Đỏ nhạt (Bán yếu): Xu hướng đang xuống, nhưng giá gần đường trung bình.
- [ ⮟ ] Đỏ đậm (Bán mạnh): Độ dốc trung bình đang xuống, và giá đã tăng lên dải trên. Đây là đỉnh chu kỳ (bán khi giá tăng).
Cách sử dụng với cBot "Follow The Trend XAU Edition"?
- Nhìn vào bên phải của bảng điều khiển (Cột HTF). Chờ sự đồng thuận rõ ràng trên các Khung Thời Gian Cao hơn (ví dụ, H4 và D1 hiển thị Mũi tên Xanh đậm/nhạt).
- Nhìn vào bên trái của bảng điều khiển (Cột LTF) để tìm một đợt hồi giá cục bộ (ví dụ, M15 hiển thị mũi tên "Mua mạnh" Xanh đậm).
- Khi logic MTF đồng bộ, kích hoạt cBot Follow The Trend XAU Edition theo hướng "MUA" và để thuật toán của nó xử lý việc vào lệnh, dừng lỗ theo sau và quản lý rủi ro.
Tùy chỉnh
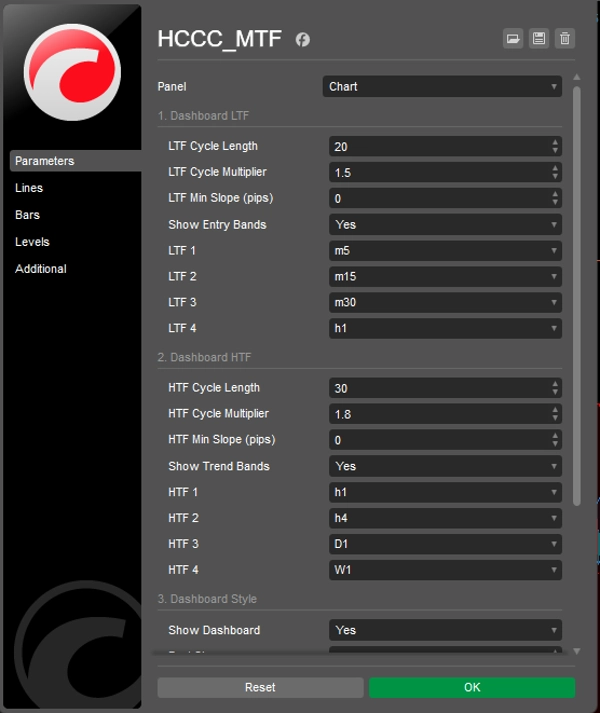
Mọi thứ đều có thể tùy chỉnh hoàn toàn: Độ dài chu kỳ, hệ số nhân ATR, độ nhạy độ dốc tối thiểu (tính bằng pip) để lọc nhiễu, và kiểm soát đầy đủ màu sắc giao diện cũng như vị trí hiển thị.
Tải ngay miễn phí và nâng tầm giao dịch bán tự động của bạn!
Tóm tắt
It overlays two cloud-filled channels: a blue "Entry Cycle" channel based on the current timeframe and a red "Trend Cycle" channel derived from a selected higher timeframe. The dashboard provides advanced five-state cyclic signals indicating strong or weak buy/sell conditions and neutral phases by analyzing the slope of the median line and price position relative to ATR bands.
The indicator is fully customizable, including cycle lengths, ATR multipliers, slope sensitivity, and UI appearance. It is intended to complement the "Follow The Trend XAU Edition" cBot by providing visual cycle and momentum analysis to guide semi-automated trade execution and management. The HCCC MTF supports various markets including Forex, commodities, indices, stocks, and cryptocurrencies.