
Mô tả
Chỉ Báo Mô Hình Búa – Giải Thích Chiến Lược
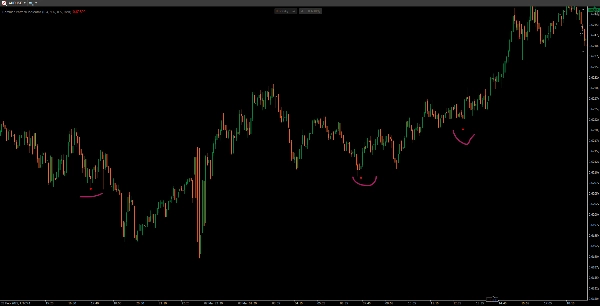
Đây là Chỉ Báo Mô Hình Búa, một tín hiệu đảo chiều dựa trên nến nhận diện mô hình búa tăng giá trong xu hướng giảm. Nó được thiết kế để phát hiện các khả năng đảo chiều xu hướng và làm nổi bật cơ hội mua vào.
Cách Hoạt Động
1️⃣ Phát Hiện Xu Hướng Giảm
- Giá đóng cửa của nến phải thấp hơn giá đóng cửa 3 cây nến trước, cho thấy khả năng xu hướng giảm.
2️⃣ Xác Thực Cấu Trúc Nến Búa
- Thân Nến Nhỏ: Thân nến tương đối nhỏ (≤ 30% tổng phạm vi).
- Bóng Dưới Dài: Bóng dưới ít nhất gấp 2 lần kích thước thân nến (cho thấy sự từ chối mạnh mẽ giá thấp hơn).
- Bóng Trên Ngắn: Bóng trên ≤ 30% kích thước thân nến (cho thấy ít sự kháng cự ở đỉnh).
3️⃣ Hiển Thị Tín Hiệu Mua
- Nếu tất cả các điều kiện được đáp ứng, một chấm đỏ (hoặc màu được chọn) xuất hiện nhỏ hơn một chút so với đáy của cây nến búa như một xác nhận trực quan cho khả năng đảo chiều.
Các Tính Năng Chính
✅ Lọc các tín hiệu yếu bằng cách đảm bảo có xu hướng giảm trước đó.
✅ Tham số tùy chỉnh cho kích thước thân nến, độ dài bóng nến và màu sắc.
✅ Mô hình nến đơn giản nhưng hiệu quả dành cho nhà giao dịch swing và nhà giao dịch hành động giá.
📌 Sử Dụng Tốt Nhất: Xác nhận mô hình búa với các chỉ báo bổ sung (ví dụ: khối lượng, mức hỗ trợ) để có tín hiệu mạnh hơn! 🚀
Tóm tắt
Đánh giá của khách hàng
5 | 100 % | |
4 | 0 % | |
3 | 0 % | |
2 | 0 % | |
1 | 0 % |


