
Mô tả
🚀 Hơn 10.000 nhà giao dịch đã sử dụng các chỉ báo TOP của chúng tôi🏆
Khám phá lý do tại sao các chuyên gia chọn chúng tôi – những công cụ mạnh mẽ nhất trên cTrader (chỉ báo, thuật toán và cBots) đang chờ bạn.
👉 Nhận tất cả các hệ thống TOP của chúng tôi tại đây:
_______________________________________________
_______________________________________________
📌 Chỉ báo Cấu trúc Thị trường
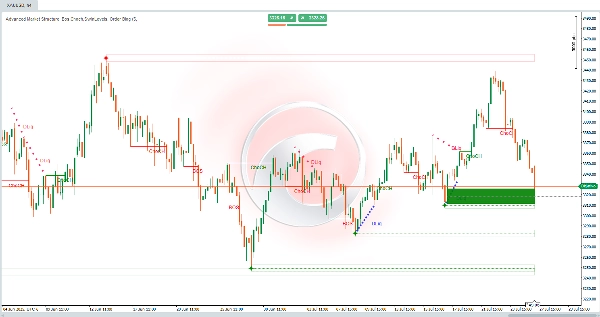
· ✅ AdvancedMarket Structure: Bos, Choch, SwinLevels, Order Blocks, Market Structure& Liquidity Finder
· 🔄 Dynamic Market StructureAnalysis of Turning Points
· 🧱 Order Block
· ⚖️ Market Imbalance
· ⛓️ BOS & CHOCH
· 🧠 ICT Power of 3
______________________________________________________________-
Store cBots : 🧠 Gold & BTC BreakoutSession Pivots 🧠
_______________________________________________
🔚 Hệ thống Thoát Thông minh
· 📍 Thuật toán Thông minh Theo Sau
_______________________________________________
📐 Chỉ báo ZigZag
· 🔍 Dự báo Thanh khoản Giá ZigZag
· ➖ ZigZag
· 🎯 Bộ theo dõi Cực điểm Zig-Zag
_______________________________________________
🧱 Chỉ báo Hỗ trợ & Kháng cự
· 🟩 Đường Hỗ trợ & Kháng cự SmartTrend
· 🧱 Tất cả các Mức Hỗ trợ và Kháng cự
_______________________________________________
📊 Chỉ báo Xu hướng & Kênh
· 📊 Supertrend
· ⚡Bộ Phân tích Xu hướng Động lượng
· ⭐ KÊNH SSL CAO CẤP
_______________________________________________
💧 Công cụ Khối lượng & Thanh khoản
· 🔥 Bản đồ Nhiệt POC Khối lượng
· 🔍 Khoảng cách Giá trị Công bằng Động lượng
· 🕒 Phiên Khoảng cách Giá trị Công bằng
_______________________________________________
⚡ Chỉ báo Động lượng & RSI
· 🔎 Bộ theo dõi Định hướng Nến Đa cấp
_______________________________________________
🔮 Công cụ Dự đoán & Dự báo
· 📐 Dự đoán dựa trên Linreg& ATR
· 📏 Hồi quy Tuyến tính Fibonacci Đa khung thời gian
· 📈 Máy chiếu Dòng chảy Thị trường dựa trên Khối lượng
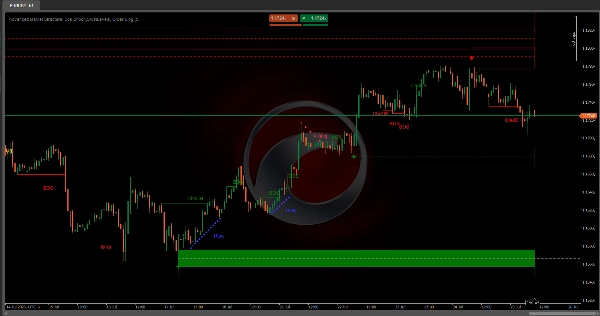
Advanced Market Structure: Bos, Choch, SwinLevels, Order Blocks, Market Structure & Liquidity Finder.
Nó là gì?
Một công cụ hành động giá nâng cao kết hợp nhiều khái niệm phân tích kỹ thuật vào một chỉ báo mạnh mẽ. Tích hợp:
- 📊 Cấu trúc Thị trường
- 🔄 Mức Swing
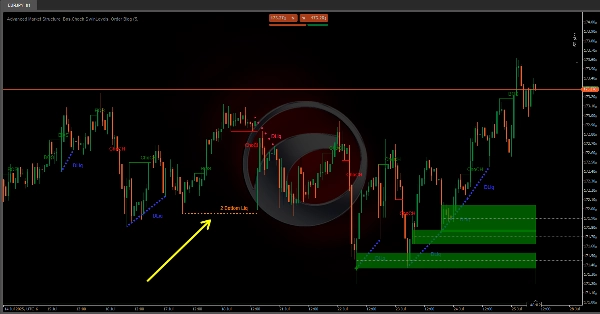
- 🧱 Khối Lệnh
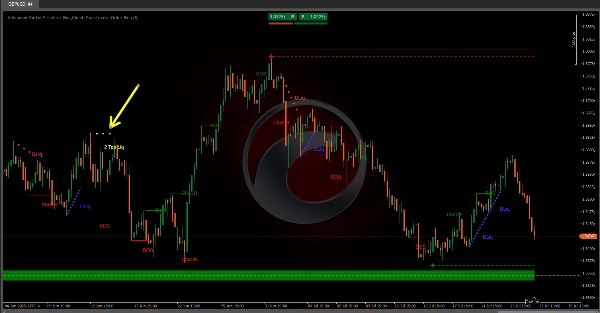
- 💧 Công cụ Tìm Thanh khoản (2 Đáy & 2 Đỉnh)
Mục tiêu: Xác định các điểm vào/ra chính, xu hướng, hỗ trợ/kháng cự và các vùng tổ chức nơi giá phản ứng.
🧠 Triết lý Cốt lõi: Tiền Thông minh
Thị trường được điều khiển bởi các nhà đầu tư tổ chức (ngân hàng, quỹ, nhà tạo lập thị trường) với nguồn lực vượt trội. Họ tạo ra các mô hình để:
- 🕵️♂️ Ẩn hoạt động trong quá trình tích lũy/phân phối.
- 🎯 Săn thanh khoản (dừng lỗ của nhà đầu tư cá nhân).
- 🚀 Thúc đẩy các chuyển động bùng nổ trong các thị trường mất cân bằng.
🔑 Các thành phần:
1. Khối Lệnh
- Là gì: Các vùng nơi các tổ chức thực hiện các lệnh lớn, tạo ra sự mất cân bằng.
- Loại:
-
- 🟢 Tăng giá (Cầu): Mua mạnh của tổ chức.
- 🔴 Giảm giá (Cung): Bán mạnh của tổ chức.
- Tín hiệu chính: Giá bật lại/đảo chiều tại các khối lệnh.
- Phát hiện:
-
- Đột biến khối lượng gần đỉnh (giảm giá) hoặc đáy (tăng giá).
2. Mức Swing
- Mục đích: Xác định cấu trúc thị trường thông qua các đỉnh/đáy chính.
- Phá vỡ quan trọng:
-
- 🔺 Phá đỉnh Swing: Tiếp tục xu hướng tăng.
- 🔻 Phá đáy Swing: Tiếp tục xu hướng giảm.
3. Phá vỡ Cấu trúc (BoS)
- Định nghĩa: Phá vỡ quyết định các đỉnh swing (tăng giá) hoặc đáy (giảm giá).
- Kết nối Fractal:
-
- 🐂 Fractal Tăng giá: Mẫu 5 nến với đáy thấp nhất ở giữa.
- 🐻 Fractal Giảm giá: Mẫu 5 nến với đỉnh cao nhất ở giữa.
4. Thay đổi Tính cách (ChoCh)
- Định nghĩa: Sự thay đổi cấu trúc báo hiệu đảo chiều xu hướng.
- Kích hoạt:
-
- Phá đáy swing trong xu hướng tăng (ChoCh giảm giá).
- Phá đỉnh swing trong xu hướng giảm (ChoCh tăng giá).
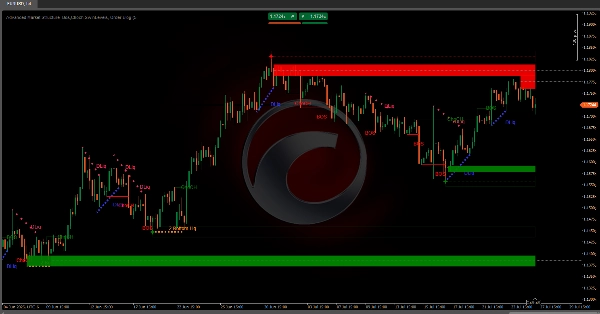
5. Vùng Thanh khoản
- Loại:
-
- ⚖️ Tĩnh: Các mức ngang với các đỉnh/đáy tập trung (lọc bằng ATR).
- 🏃 Động: Đường xu hướng nối các điểm pivot dốc.
- Mẫu chính:
-
- 🕯️ 2 Đỉnh/2 Đáy: Săn dừng lỗ của tổ chức.
- ⛰️ 3 Đỉnh/Đáy: Vùng tắc nghẽn cao.
🎯 Ứng dụng chính
- ✅ Xác định xu hướng/đảo chiều qua BoS/ChoCh.
- 📍 Xác định hỗ trợ/kháng cự sử dụng mức swing & vùng thanh khoản.
- 🏦 Phát hiện khối lệnh tổ chức.
- 🎯 Dự đoán mục tiêu giá qua vùng thanh khoản.
🔄 Chiến lược Tiền Thông minh
Tín hiệu Giai đoạn Hành động Tổ chức
1. Tích lũy
ChoCh tăng giá + Khối lệnh Cầu 📈
Tiền Thông minh mua vào
2. Tăng giá
BoS liên tiếp + khoảng trống FVG 🚀
Nhà đầu tư cá nhân thúc đẩy động lượng
3. Phân phối
ChoCh giảm giá tại Thanh khoản 2 Đỉnh 🎯
Tiền Thông minh bán ra
4. Giảm giá
BoS giảm giá + Thanh lý vùng giảm giá 🔻
Săn dừng lỗ tại đáy
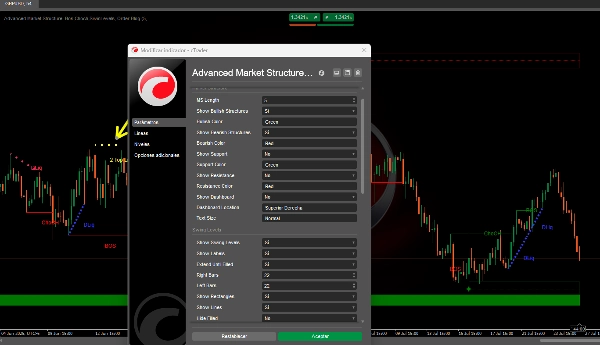
⚙️ Hướng dẫn Điều chỉnh Tham số
Cấu trúc Thị trường
Độ dài MS:-
- ⬆️ Tăng: Ít fractal hơn nhưng đáng tin cậy hơn.
- ⬇️ Giảm: Nhạy cảm hơn (rủi ro nhiễu).
Mức Swing
Kích thước Swing L/R:-
- ⬆️ Tăng: Xác định các swing quan trọng.
- ⬇️ Giảm: Bắt các đảo chiều nhỏ.
Mở rộng cho đến khi được lấp đầy:-
- ✅ Bật: Các mức tồn tại cho đến khi giá chạm tới.
Khối Lệnh
Phương pháp Giảm thiểu:-
- ✨
Đuôi nến: Tín hiệu nhanh hơn (chạm đuôi nến). - 🎯
Đóng cửa: Tín hiệu mạnh hơn (đóng cửa ngoài khối lệnh).
- ✨
Công cụ Tìm Thanh khoản
Độ nhạy Tĩnh/Động:-
- ⬆️ Tăng: Ít vùng hơn (chất lượng cao hơn).
- ⬇️ Giảm: Nhiều vùng hơn (nhạy cảm hơn).
Tóm tắt
Key components include:
- **Order Blocks:** Zones of significant institutional buying (bullish) or selling (bearish) identified by volume spikes near highs or lows, signaling potential price rebounds or reversals.
- **Swing Levels:** Critical highs and lows defining market structure, with breaks indicating bullish or bearish continuations.
- **Break of Structure (BoS):** Decisive breaks of swing highs or lows, linked to fractal patterns, signaling trend direction.
- **Change of Character (ChoCh):** Structural shifts indicating trend reversals, triggered by breaking swing lows in uptrends or swing highs in downtrends.
- **Liquidity Zones:** Static (horizontal levels with clustered highs/lows) and dynamic (trendlines connecting pivots) zones highlighting institutional stop hunts and congestion areas.
The indicator supports smart money concepts, reflecting institutional market behavior phases: Accumulation, Markup, Distribution, and Markdown. Parameter tuning options allow adjustment of sensitivity and signal strength for Market Structure, Swing Levels, Order Blocks, and Liquidity Finder components. This tool aims to enhance market analysis by revealing institutional activity and improving trade decision-making.
Đánh giá của khách hàng
5 | 33 % | |
4 | 67 % | |
3 | 0 % | |
2 | 0 % | |
1 | 0 % |


