
Mô tả
Chỉ báo Pinescriptlabs Store: Pinescriptlabs Store cBots : (cBot) Gold & BTC BreakoutSession Pivots(mới)
Thuật toán thông minh theo dõi (mới)
SmartTrend Hỗ trợ &
Kháng cự
Đường
Phiên khoảng trống giá trị công bằng
Phân tích
Cấu trúc thị trường
Động
của
Điểm
Quay đầu
Fibonacci
Hồi quy
Tuyến tính
Đa khung thời gian
Khoảng trống giá trị công bằng động lực
Theo dõi
Định hướng nến
đa cấp
Tự động
Hỗ trợ và
Kháng cự
Xu hướng
Đường
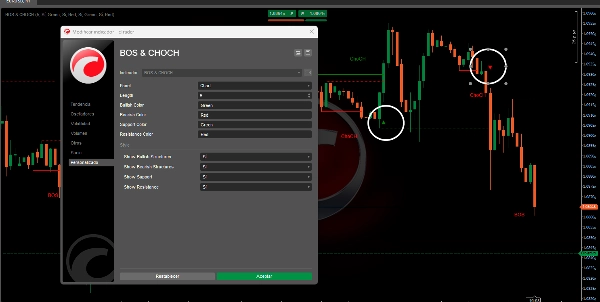
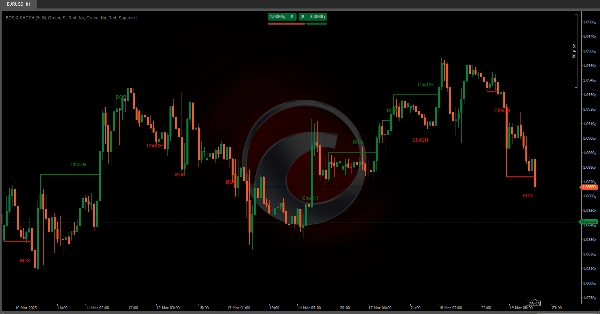
Thuật toán được thiết kế để xác định mẫu cấu trúc thị trường , cụ thể là các khái niệm Thay đổi tính cách (ChoCH) 🔄 và Phá vỡ cấu trúc (BoS) 💥. Dưới đây, tôi sẽ giải thích chi tiết thuật toán này làm gì, mục đích của nó và cách nó xác định hai khái niệm này.
Thuật toán làm gì?
Thuật toán sử dụng fractals (đỉnh và đáy cục bộ) để xác định xem giá đã thay đổi hành vi hay phá vỡ cấu trúc đã được thiết lập trước đó. Dưới đây là các chức năng chính:
Phát hiện fractal 📊
- Một fractal tăng giá xảy ra khi có một đỉnh cục bộ mà các cây nến hai bên thấp hơn. 📈
- Một fractal giảm giá xảy ra khi có một đáy cục bộ mà các cây nến hai bên cao hơn. 📉
- Những fractal này đóng vai trò là điểm tham chiếu để xác định sự thay đổi trong cấu trúc thị trường.
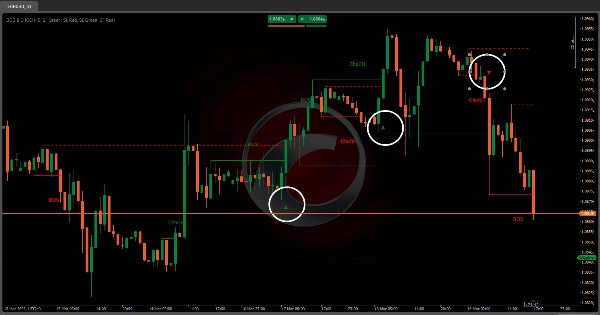
Xác định ChoCH (Thay đổi tính cách) 🔄
- Một ChoCH tăng giá xảy ra khi giá vượt qua một fractal tăng giá mà không hình thành cấu trúc giảm giá hoàn chỉnh trước đó.
- Một ChoCH giảm giá xảy ra khi giá giảm xuống dưới một fractal giảm giá mà không hình thành cấu trúc tăng giá hoàn chỉnh trước đó.
- Điều này cho thấy thị trường đã thay đổi tính cách (từ xu hướng sang tích lũy hoặc ngược lại).
Xác định BoS (Phá vỡ cấu trúc) 💥
- Một BoS tăng giá xảy ra khi giá vượt qua một fractal tăng giá sau khi đã hình thành cấu trúc giảm giá hoàn chỉnh trước đó.
- Một BoS giảm giá xảy ra khi giá giảm xuống dưới một fractal giảm giá sau khi đã hình thành cấu trúc tăng giá hoàn chỉnh trước đó.
- Điều này cho thấy thị trường đã phá vỡ cấu trúc đã được thiết lập trước đó, có thể là điểm vào hoặc thoát quan trọng.
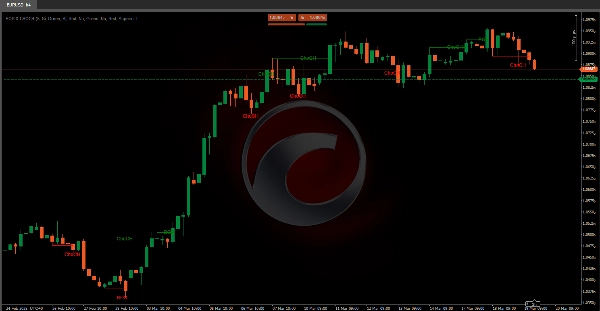
Hiển thị hỗ trợ và kháng cự 🛡️
- Thuật toán có thể vẽ đường hỗ trợ và kháng cự dựa trên các fractal được phát hiện.
- Nó cũng kiểm tra xem các đường này có bị phá vỡ không, đánh dấu các điểm phá vỡ bằng các biểu tượng trực quan.
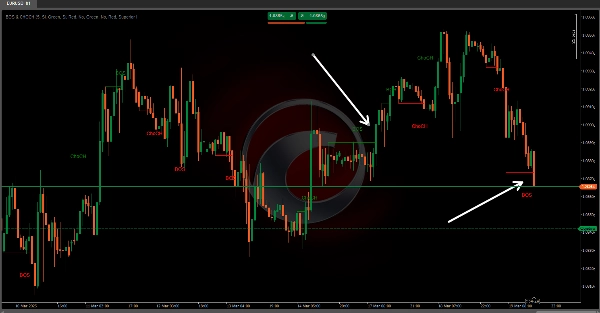
Thuật toán này cung cấp cho nhà giao dịch những hiểu biết quý giá về hành vi thị trường bằng cách xác định rõ ràng các thay đổi cấu trúc chính và cơ hội phá vỡ tiềm năng. Bằng cách tận dụng ChoCH 🔄 và BoS 💥, nhà giao dịch có thể đưa ra quyết định thông minh hơn về điểm vào, điểm ra và động lực tổng thể của thị trường.
Tóm tắt
Key functionalities include:
- **Fractal Detection:** Identifies bullish fractals (local highs with lower candles on both sides) and bearish fractals (local lows with higher candles on both sides).
- **Change of Character (ChoCH):** Signals when the market changes its behavior, such as shifting from trend to consolidation, by surpassing fractals without forming a complete opposite structure.
- **Break of Structure (BoS):** Indicates when the market breaks a previously established structure, marking potential entry or exit points.
- **Support and Resistance Visualization:** Draws support and resistance lines based on fractals and marks breakout points with visual icons.
This indicator aids traders in understanding market dynamics by clearly highlighting structural changes and breakout opportunities, supporting more informed trading decisions.
Đánh giá của khách hàng
5 | 100 % | |
4 | 0 % | |
3 | 0 % | |
2 | 0 % | |
1 | 0 % |


