
Descrizione
🔍 Esamina i dati di volume su un periodo storico specifico, evidenziando potenziali aree in cui gli investitori altamente leva potrebbero affrontare liquidazioni, fornendo preziose informazioni sul comportamento del mercato.
Cosa fa questo indicatore?
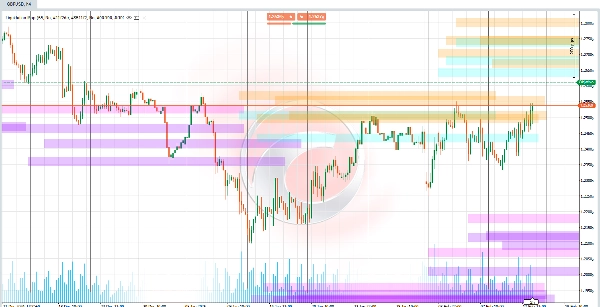
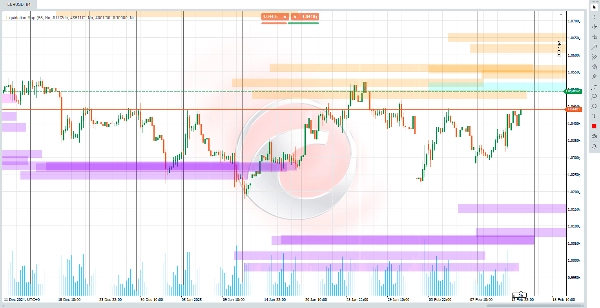
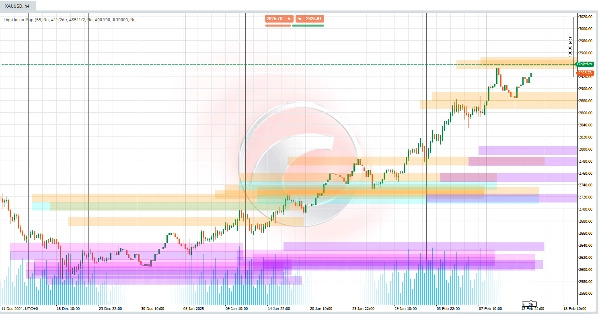
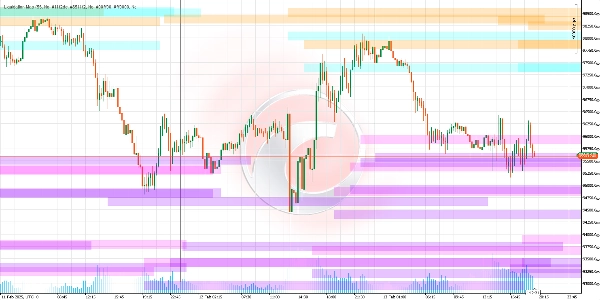
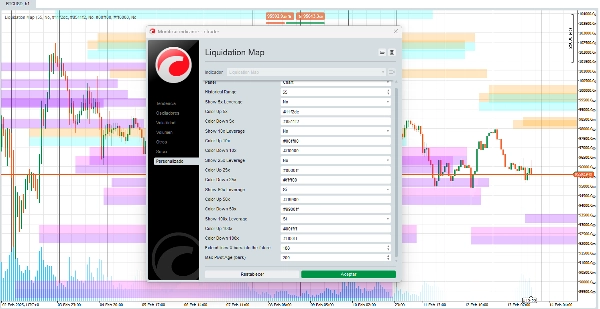
Questo algoritmo identifica i livelli di prezzo in cui massicce liquidazioni di posizioni con leva (come 5x, 10x, 25x, 50x o 100x) sono probabili. Questi livelli agiscono come "magneti" per i movimenti di prezzo, poiché le liquidazioni possono innescare forti oscillazioni di mercato. L'indicatore traccia linee orizzontali sul grafico, rappresentando queste soglie e proiettandole nel futuro per anticipare zone chiave di interesse.
Come vengono calcolati questi livelli?
- Rilevamento dei Pivot di Prezzo:
🔄 Identifica i massimi e minimi recenti nel grafico (punti in cui il prezzo cambia direzione). Questi pivot sono la base per calcolare i livelli di liquidazione. - Volume come Attivatore:
📊 Confronta il volume attuale con una media storica. Se il volume supera determinate soglie (ad esempio, 1,2x la media per 100x), attiva i livelli di liquidazione corrispondenti. - Formula di Liquidazione:
Più alta è la leva, più vicino al prezzo corrente si trova il livello di liquidazione. -
- Per posizioni long: Il livello di liquidazione è impostato sotto il pivot basso, calcolato in base alla leva (ad esempio, 2% sotto per 50x).
- Per posizioni short: Il livello è impostato sopra il pivot alto, usando lo stesso principio.
Cosa puoi aspettarti utilizzandolo?
- Linee di Liquidità: 🎨 Vedrai linee orizzontali personalizzabili che rappresentano zone dove il mercato potrebbe sperimentare alta volatilità a causa delle liquidazioni.
- Leve Configurabili: ⚙️ Puoi abilitare/disabilitare i livelli per ogni tipo di leva (ad esempio, concentrarti solo su 50x e 100x).
- Personalizzazione dei Colori: 🌈 Puoi scegliere il colore per ogni intervallo di liquidazione, adattando la visualizzazione alle tue preferenze.
- Zone di Congestione: 🎯 Più linee vicine suggeriscono aree ad alto rischio/alto rendimento dove potrebbero verificarsi liquidazioni multiple simultaneamente.
Come interpretare i segnali?
- Prezzo che si Avvicina a una Linea: 🚨 Se il prezzo si avvicina a un livello di liquidazione (specialmente con alto volume), la probabilità di un movimento brusco aumenta.
- Colore e Trasparenza: 🎨 I colori variano in base alla leva (ad esempio, blu per 25x, arancione per 50x). La trasparenza indica la "forza" del volume associato (linee più scure = volume più significativo).
Perché è utile?
- Previsione Proattiva: 🔮 Non analizza solo il passato; proietta livelli futuri basati sulle condizioni attuali.
- Focus sulla Psicologia del Mercato: 🧠 Le liquidazioni forzate spesso creano reazioni a catena (ad esempio, ordini stop-loss che innescano ulteriori vendite). Questo indicatore ti aiuta ad anticiparle.
- Personalizzazione: 🛠️ Adatta la visualizzazione alla tua strategia (ad esempio, prioritizza leve più alte in mercati volatili).
Limitazioni da considerare
- Dipendenza dal Volume: 📉 Se il volume è basso o i dati storici insufficienti, i segnali potrebbero essere meno affidabili.
- Non una Sfera di Cristallo: 🔮 I livelli indicano zone probabili, non certezze. Combinalo sempre con altre analisi.
- Ambiente Dinamico: 🌍 In mercati con notizie impreviste, le liquidazioni possono avvenire al di fuori dei livelli proiettati.
Indicatori del Ctrader Store:
Dynamic Market Structure
Analysis of Turning Points
Fibonacci Linear
Regression Multi-timeframe
Multi-Level Candle Bias
Tracker
Auto Support and
Resistance Trend Lines
Riepilogo
The indicator calculates these levels by detecting recent price pivots (highs and lows), comparing current volume against historical averages to activate relevant leverage thresholds, and applying a formula where higher leverage corresponds to liquidation levels closer to the current price. For long positions, liquidation levels are set below pivot lows; for short positions, above pivot highs.
Users can customize the indicator by enabling or disabling specific leverage levels and adjusting the colors of the liquidation lines. Clusters of lines indicate congestion zones with heightened risk and potential for sharp price swings. The transparency of lines reflects the strength of associated volume.
This tool aids in proactive forecasting of market moves driven by forced liquidations, helping traders anticipate volatility and market psychology effects. It is volume-dependent and should be used alongside other analyses, as it indicates probable zones rather than certainties.
Recensioni dei clienti
5 | 67 % | |
4 | 0 % | |
3 | 33 % | |
2 | 0 % | |
1 | 0 % |


