
Opis
═══════════════════════════════════════════════════════════════
EMA MTF TREND PRO — wskaźnik analizy trendu wielookresowego
wskaźnik nakładkowy cTrader
═══════════════════════════════════════════════════════════════
Zobacz pełny obraz trendu na 6 ramach czasowych — w jednej tabeli,
na jednym wykresie, bez przełączania okien.
───────────────────────────────────────────────────────────────
CO ROBI
───────────────────────────────────────────────────────────────
EMA MTF Trend Pro łączy kierunek trendu EMA, strukturę kanału Wildera,
poziomy Kijun-sen, siłę ADX, sygnały przecięcia oraz wyczerpanie momentum
w jednym, aktywnym panelu kontrolnym.
Każdy wiersz w tabeli to inna ramka czasowa. Każda kolumna
odpowiada na inne pytanie dotyczące tej ramki czasowej. Jeden rzut oka
informuje, czy ramki czasowe się zgadzają — i czy bezpiecznie jest
wejść na rynek.
───────────────────────────────────────────────────────────────
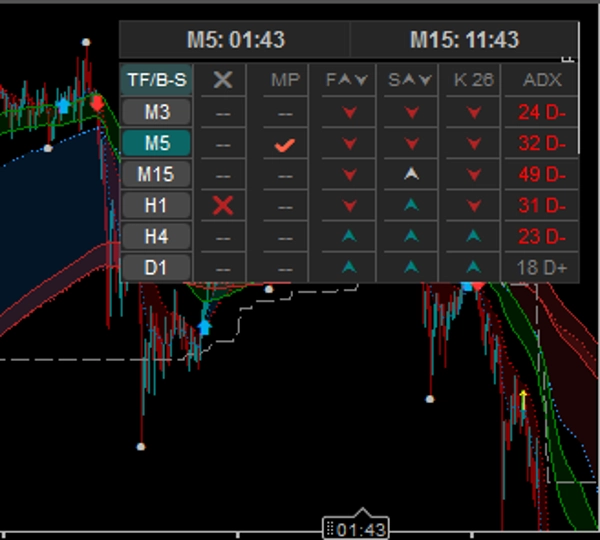
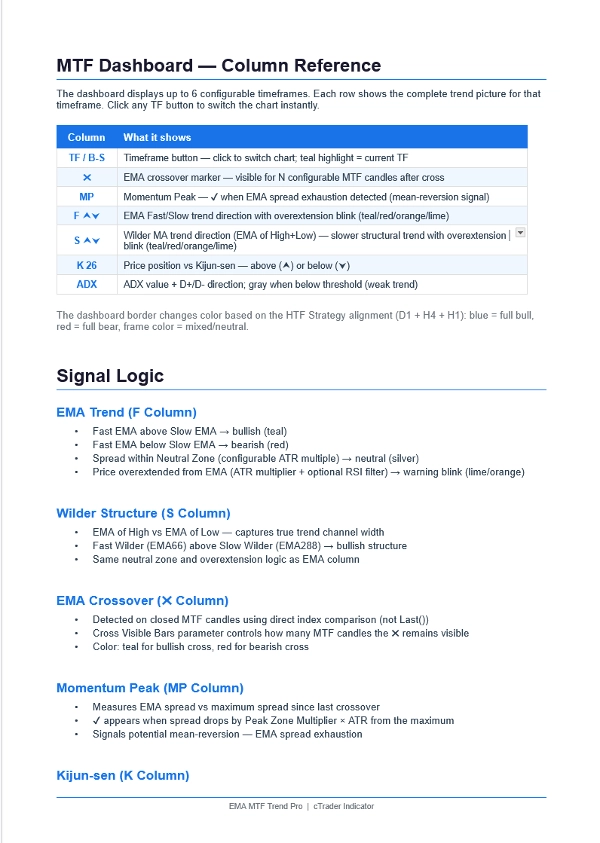
PANEL KONTROLNY — 6 RAM CZASOWYCH × 7 KOLUMN
───────────────────────────────────────────────────────────────
Kolumna Co pokazuje
──────── ──────────────────────────────────────────────────
TF/B-S Przycisk ramki czasowej — kliknij, aby natychmiast przełączyć wykres
Turkusowe podświetlenie = aktualnie wyświetlana ramka czasowa
✖ Przecięcie EMA — widoczne dla N konfigurowalnych świec
Turkusowy = przecięcie wzrostowe | Czerwony = przecięcie spadkowe
MP Szczyt momentum — ✔ gdy rozpiętość EMA jest wyczerpana
Sygnał ostrzegawczy odwrócenia do średniej
F ⮝⮟ Kierunek trendu EMA szybki vs wolny
Turkusowy = wzrostowy | Czerwony = spadkowy | Srebrny = neutralny
Miga, gdy cena jest nadmiernie oddalona od EMA
S ⮝⮟ Struktura Wilder MA (EMA High/Low)
Wolniejszy, bardziej strukturalny filtr trendu
K 26 Cena vs Kijun-sen
⮝ = cena powyżej (wsparcie) | ⮟ = poniżej (opór)
ADX Siła trendu + kierunek D+/D-
Szary = słaby/rynek boczny (poniżej progu)
───────────────────────────────────────────────────────────────
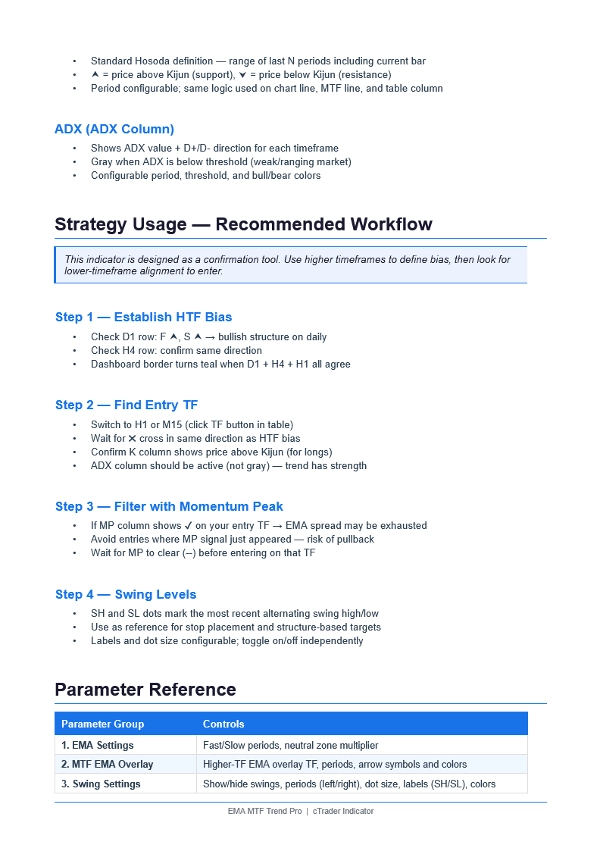
CECHY
───────────────────────────────────────────────────────────────
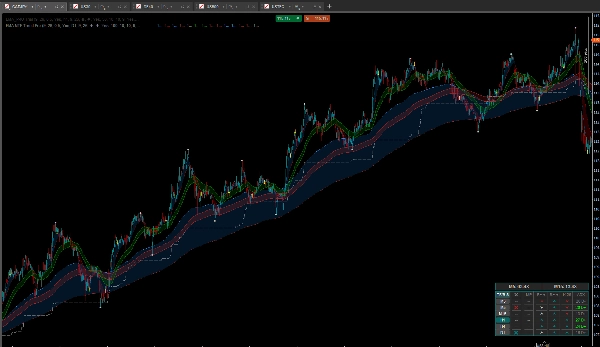
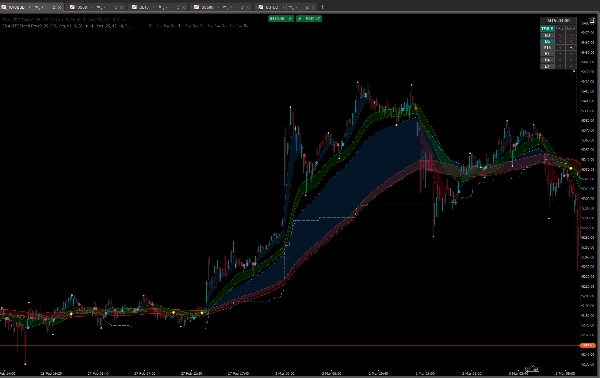
SYSTEM CHMURY EMA
• Szybka + wolna EMA z kolorowym wypełnieniem chmury
• Wykrywanie strefy neutralnej (konfigurowalny mnożnik ATR)
• Alerty o nadmiernym oddaleniu z filtrem RSI
NAKŁADKA MTF EMA
• Projekcja dowolnej EMA z wyższej ramki czasowej na aktualny wykres
• Interpolacja liniowa — gładkie linie, bez skoków
• Strzałki przecięcia z konfigurowalnymi symbolami i kolorami
• Automatyczne ukrywanie strzałek nakładki przy wybraniu wyższej ramki czasowej
w panelu kontrolnym (zapobiega wizualnemu bałaganowi)
SZCZYTY I DOŁKI SWINGÓW
• Naprzemienne kropki SH / SL — brak powtarzających się kolejnych szczytów
• Opcjonalne etykiety tekstowe SH / SL z pozycjonowaniem na podstawie ATR
• Konfigurowalny rozmiar kropek, rozmiar etykiet, kolory
• Pojedynczy przełącznik włącz/wyłącz dla całego wyświetlania swingów
KIJUN-SEN
• Standardowa definicja Hosody (zgodna z TradingView / MT4)
• Konfigurowalny okres
• Dostępna również jako linia nakładki MTF na wykresie
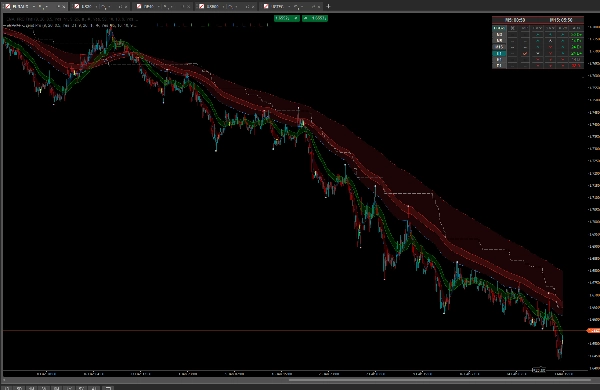
PASKI MA-WILDER
• EMA High i EMA Low — tworzy kanał trendu
• Szybki pasek (EMA66) + wolny pasek (EMA288)
• Dostępne na wykresie i jako nakładka MTF
GRANICA STRATEGII HTF
• Ramka panelu kontrolnego zmienia kolor na turkusowy, gdy D1 + H4 + H1
są wszystkie wzrostowe (EMA + Wilder zgodne)
• Zmienia kolor na czerwony, gdy wszystkie trzy są spadkowe
• Natychmiastowe wizualne potwierdzenie pełnej zgodności wielookresowej
TIMER ODWROTU ŚWIEC
• Podwójne timery — dowolne dwie ramki czasowe
• Drugi timer może śledzić aktualną ramkę czasową wykresu
• Kompaktowy układ w trybie jednokolumnowym
TRYB KOMPAKTOWY / PEŁNY
• Kliknij nagłówek TF/B-S, aby przełączyć
• Tryb pełny: 7 kolumn (wszystkie sygnały)
• Tryb kompaktowy: 3 kolumny (TF, EMA, Wilder) — minimalne miejsce
───────────────────────────────────────────────────────────────
STRATEGIA — JAK UŻYWAĆ
───────────────────────────────────────────────────────────────
KROK 1 — USTAL PREFERENCJE (Wyższe ramki czasowe)
• Wiersz D1: F ⮝ + S ⮝ = wzrostowa struktura dzienna
• Wiersz H4: ten sam kierunek = potwierdzony trend
• Ramka panelu kontrolnego zmienia kolor na turkusowy = D1 + H4 + H1 się zgadzają
KROK 2 — ZNAJDŹ WEJŚCIE (Niższa ramka czasowa)
• Kliknij H1 lub M15 w tabeli, aby przełączyć wykres
• Poczekaj na ✖ przecięcie w tym samym kierunku co preferencje HTF
• Kolumna K pokazuje ⮝ (cena powyżej Kijun) dla pozycji długich
• Kolumna ADX jest aktywna, nie szara (trend ma siłę)
KROK 3 — FILTRUJ ZA POMOCĄ SZCZYTU MOMENTUM
• Kolumna MP pokazuje ✔ → rozpiętość EMA wyczerpana → unikaj wejścia
• Poczekaj, aż MP zniknie (--) przed wejściem
• Używaj na niższych TF, aby unikać wejścia na ekstremach EMA
KROK 4 — UŻYWAJ POZIOMÓW SWINGÓW
• Kropka SH = najnowszy szczyt swingowy (opór / odniesienie stop)
• Kropka SL = najnowszy dołek swingowy (wsparcie / odniesienie celu)
• Kropki na przemian — zawsze jeden szczyt, jeden dołek na raz
───────────────────────────────────────────────────────────────
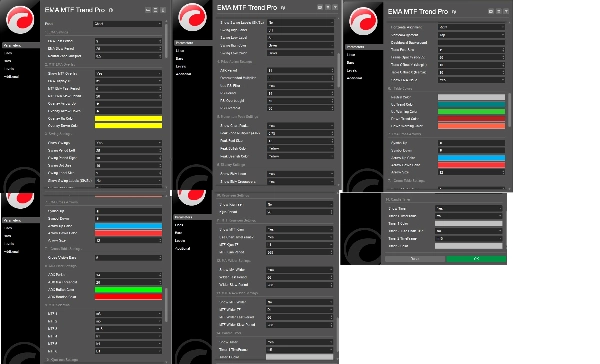
GRUPY PARAMETRÓW
───────────────────────────────────────────────────────────────
1. Ustawienia EMA — okresy szybkie/wolne, strefa neutralna
2. Nakładka MTF EMA — TF, okresy, styl strzałek
3. Ustawienia swingów — pokaz/ukryj, okresy, etykiety, kolory
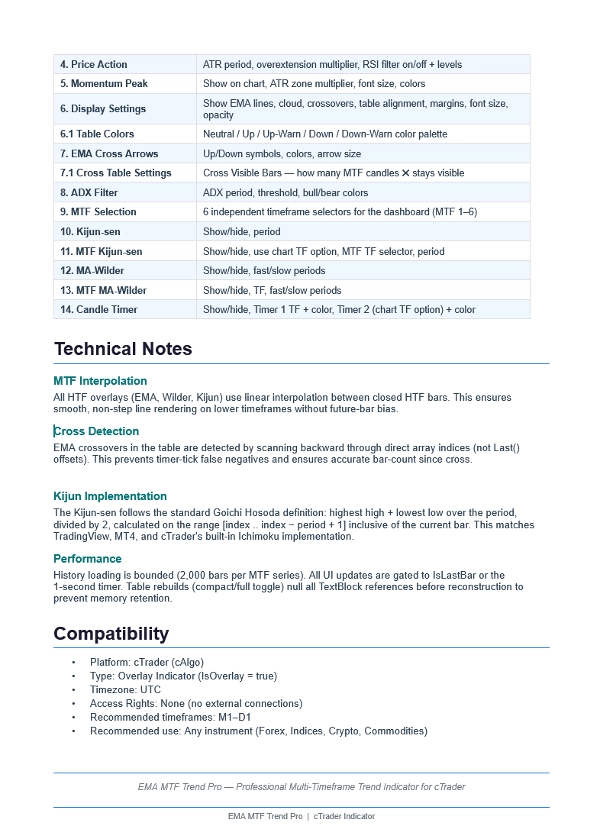
4. Akcja cenowa — ATR, nadmierne oddalenie, filtr RSI
5. Szczyt momentum — mnożnik strefy, czcionka, kolory
6. Ustawienia wyświetlania — linie, chmura, układ tabeli
6.1 Kolory tabeli — pełna kontrola palety kolorów
7. Strzałki przecięcia EMA — symbole, kolory, rozmiar
7.1 Ustawienia tabeli przecięć — widoczne świece przecięcia (N świec)
8. Filtr ADX — okres, próg, kolory
9. Wybór MTF — 6 × niezależnych selektorów TF
10. Kijun-sen — pokaz/ukryj, okres
11. MTF Kijun-sen — TF, okres, opcja TF wykresu
12. MA-Wilder — pokaz/ukryj, okresy szybkie/wolne
13. MTF MA-Wilder — TF, okresy szybkie/wolne
14. Timer świec — TF, kolory, opcja TF wykresu
───────────────────────────────────────────────────────────────
Podsumowanie
Opinie klientów
5 | 0 % | |
4 | 100 % | |
3 | 0 % | |
2 | 0 % | |
1 | 0 % |


![Logo „[Hamster-Coder] Pivot Points MTF”](https://cdn.ctrader.com/image/webp/4c143e5a-309c-40e3-a578-f04d1e133ffa_31159)

