
설명
KNN 머신러닝 모멘텀 지체하지 마세요. 예측을 시작하세요. 기관급 K-최근접 이웃 분석.
기본 매개변수는 XAUUSD에 최적화되어 있습니다. 모든 타임프레임에서 작동하며, 거래 스타일에 따라 선택하세요. 높은 타임프레임은 더 깨끗하고 확률이 높은 신호를 제공합니다. 낮은 타임프레임은 약간 더 많은 노이즈와 함께 더 많은 신호를 생성합니다. 아래 타임프레임 가이드를 참조하세요.
🥈 또한 이용 가능: XAGUSD 자동화 봇 버전 논리가 마음에 드시나요? 더 나아가 보세요. 이 지표의 전용 봇 버전 — XAGUSD (은) 에 맞게 세밀하게 조정된 버전이 마켓플레이스에서 제공됩니다. 완전 자동으로 작동하며 수동 입력 없이 거래를 실행합니다. 투자 수익률 대비 저렴한 가격입니다.
👉 KNN XAGUSD 봇 — cTrader 마켓에서 보기
⏱ 타임프레임 가이드
타임프레임신호량비고
M5
매우 높음
노이즈가 많아 과도한 거래를 피하기 위해 더 엄격한 규율과 필터링이 필요합니다.
M8
높음 (기본값)
최적화된 기준선입니다. XAUUSD에 대해 신호 빈도와 정확성 간의 최상의 균형을 제공합니다.
M15
중간
더 깨끗하고 고품질의 신호를 제공하며 세션당 진입 횟수가 적습니다.
M30 / H1
낮음
가장 높은 정확성 — 더 많은 인내심이 필요한 스윙 스타일 설정에 가장 적합합니다.
기본 매개변수는 M8에서 백테스트되었습니다. 타임프레임을 변경할 경우 ATR 기간과 SL/TP 배수를 적절히 조정하는 것을 고려하세요.
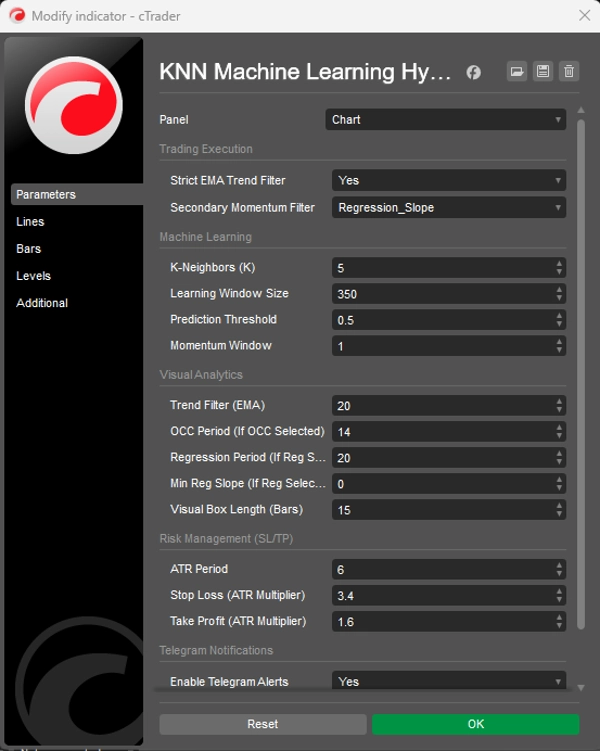
⚙️ 기본 매개변수
학습 창 (350) — KNN 엔진이 패턴 매칭을 위해 스캔하는 과거 캔들 수입니다.
예측 임계값 (0.5) — 신호가 생성되기 전에 필요한 최소 신뢰 점수입니다.
ATR 기간 (6) — SL/TP 크기 조정을 위한 평균 실제 범위 계산에 사용되는 기간입니다.
손절 배수 (3.4) — SL 거리 = ATR × 3.4. 금의 변동성에 여유를 주기 위해 넓게 설정되었습니다.
이익실현 배수 (1.6) — TP 거리 = ATR × 1.6. 빠르게 이익을 확보하고 높은 승률을 유지하기 위해 더 타이트하게 설정되었습니다.
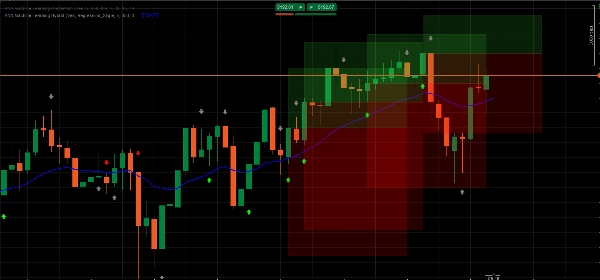
추세 필터 EMA (20) — 추세 필터로 사용되는 EMA 기간 — 차트의 파란 선입니다.
🤖 예측 KNN 엔진 RSI와 MA 편차를 과거 매칭 알고리즘으로 압축합니다. 각 캔들마다 최근 350개 바를 스캔하여 가장 유사한 과거 5개의 순간을 찾아 방향을 예측합니다.
📈 엄격한 EMA 추세 필터 낮은 확률의 역추세 설정을 자동으로 억제합니다. 광범위한 추세와 일치하는 신호만 높은 확률로 표시됩니다.
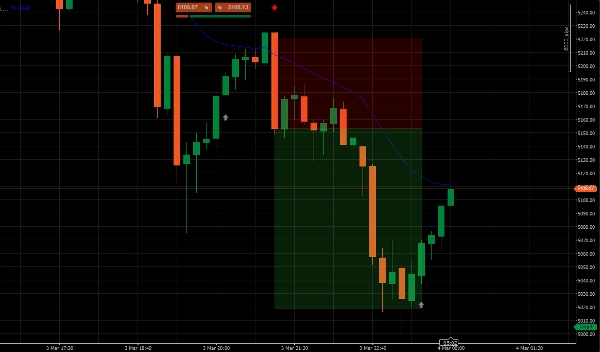
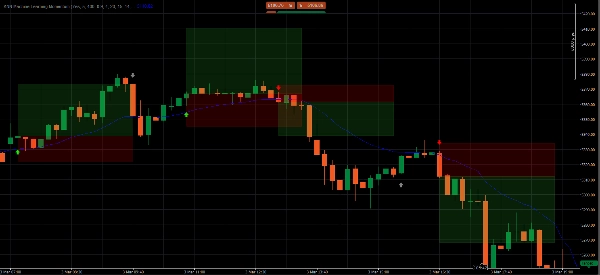
📦 동적 ATR 목표 구역 ATR을 통해 현재 시장 변동성에 실시간으로 적응하는 투명한 색상 박스를 이익실현 및 손절 구역으로 투영합니다.
🧹 UI 메모리 관리자 오래된 구역을 자동으로 제거하여 차트를 깔끔하게 유지합니다. 항상 가장 최근 5개의 설정만 표시됩니다.
📲 텔레그램 푸시 알림 내장 웹훅 통합으로 정확한 진입, TP, SL 가격과 함께 즉시 거래 알림을 휴대폰으로 전송합니다.
📊 신호 해석하기
🟢 밝은 녹색 화살표 — 높은 확률의 매수 KNN이 가격 상승을 예측하고 가격이 EMA 위에 있습니다. 완전한 추세 정렬. 이것이 거래할 프리미엄 설정입니다.
🔴 밝은 빨간 화살표 — 높은 확률의 매도 KNN이 가격 하락을 예측하고 가격이 EMA 아래에 있습니다. 완전한 추세 정렬. 신호 캔들이 닫힐 때 진입하세요.
⚪ 회색 화살표 — 역추세 (거래하지 마세요) 모멘텀 변화가 감지되었지만 광범위한 추세와 반대입니다. 인지용으로만 표시되며 확률이 크게 낮습니다.
▶️ 실행 가이드
- 밝은 녹색 또는 밝은 빨간 화살표를 기다리세요 — 회색 신호는 완전히 무시하세요.
- 진입하기 전에 신호 캔들이 완전히 닫힐 때까지 기다리세요.
- 각 박스의 외곽 수평 가장자리 — 진입 가격에서 가장 먼 쪽 가장자리에 SL과 TP를 설정하세요.
❓ 자주 묻는 질문
왜 화살표가 나타나나요? 매 캔들마다 알고리즘이 현재 RSI와 MA 모멘텀을 스냅샷하고, 최근 350개 바에서 가장 수학적으로 유사한 5개의 순간을 스캔하여 그 순간들에서 가격이 어떻게 움직였는지 기반으로 방향을 예측합니다.
밝은 화살표와 회색 화살표의 차이는 무엇인가요? 밝은 화살표 = AI 신호와 EMA 추세가 완전히 일치 — 가장 높은 확률. 회색 화살표 = 모멘텀이 감지되었지만 역추세 — 거래하기에 너무 위험하다고 표시됨.
어떤 타임프레임을 사용해야 하나요? M8이 최적화된 기본값입니다. 높은 타임프레임(M15, M30, H1)은 신호가 적지만 더 깨끗합니다. M5는 더 많은 신호를 제공하지만 더 엄격한 필터링 규율이 필요합니다.
SL과 TP는 정확히 어디에 설정해야 하나요? 각 색상 박스의 외곽 수평 가장자리 — 진입 가격에서 가장 먼 쪽 가장자리에 설정하세요.
금 이외의 자산에도 사용할 수 있나요? 네 — cTrader의 모든 자산에 적용 가능합니다. 다만 매개변수는 XAUUSD에 대해 특별히 백테스트되었습니다. 다른 상품은 매개변수 조정 기간이 필요할 수 있습니다.
⚠️ 위험 고지 외환, 원자재 및 마진 CFD 거래는 높은 위험을 수반하며 모든 투자자에게 적합하지 않을 수 있습니다. 이 지표는 교육 및 정보 제공 목적으로만 사용되는 정량적 분석 도구이며 금융 조언을 구성하지 않습니다. 과거 실적은 미래 결과를 보장하지 않습니다. 실거래 자본을 위험에 노출하기 전에 반드시 데모 계정에서 테스트하세요.
요약
Key functionalities include dynamic Average True Range (ATR)-based stop loss and take profit target zones that adapt to market volatility, and a UI memory manager that keeps charts clear by displaying only the five most recent setups. Signals are visually represented by arrows: bright green for high-probability buy, bright red for high-probability sell, and gray for counter-trend momentum (not recommended for trading). The indicator supports multiple timeframes, with M8 as the default optimized setting balancing signal frequency and accuracy.
Additionally, it integrates Telegram push alerts via webhook, delivering real-time trade signals with precise entry, stop loss, and take profit levels. Users are advised to wait for signal candle closure before entering trades and to place stops and targets at the edges of the ATR target zones. Parameters such as learning window, prediction threshold, ATR period, and multipliers for stop loss and take profit are configurable to suit different trading styles.


