calculateSpreads_withSourceCode
Indicatore
204 download
Versione 1.0, Mar 2025
Windows, Mac
5.0
Recensioni: 1

Descrizione
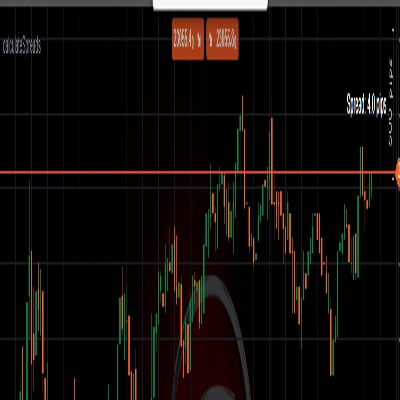
L'indicatore calcola lo spread in pips
Riepilogo
Riepilogo AI
This indicator calculates the spread in pips for trading instruments. It provides a numerical measure of the difference between bid and ask prices, expressed in pips, which is a standard unit in forex and other markets. The product includes source code, allowing users to review or modify the calculation logic. It is designed for integration within trading platforms to assist traders in monitoring spread values directly on their charts.
Profilo indicatore
Recensioni dei clienti
5.0
Recensioni: 1
5 | 100 % | |
4 | 0 % | |
3 | 0 % | |
2 | 0 % | |
1 | 0 % |
Recensioni dei clienti
August 18, 2025
Real-time spread monitoring, customizable, open-source for modification. Cons: No history chart, no alerts, limited analytics.
Discussioni
Domande frequenti
I prodotti disponibili tramite cTrader Store, inclusi bot di trading, indicatori e plugin, sono forniti da sviluppatori terzi e resi disponibili esclusivamente a scopo informativo e di accesso tecnico. cTrader Store non è un broker e non fornisce consulenze in materia di investimento, raccomandazioni individualizzate o garanzie di risultati futuri.
Potrebbe interessarti anche


![Logo di "[Stellar Strategies] Market Regime Filter"](https://cdn.ctrader.com/image/webp/3bdeba11-7e8b-4e5f-9af9-d562f48df039_28423)


Prezzo
Da 27/02/2025
204
Installazioni gratuite