
Descrizione
| ALL IN ONE TRADING PRO|
## Cos'è questo indicatore?
Questo indicatore mette **tre utili strumenti di trading** sul tuo grafico contemporaneamente. Pensalo come avere tre trader esperti che ti danno la loro opinione allo stesso tempo
=====================================================
## I tre strumenti
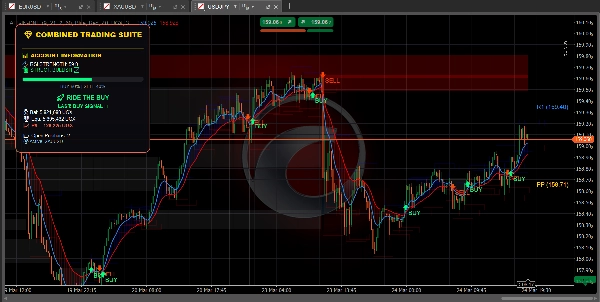
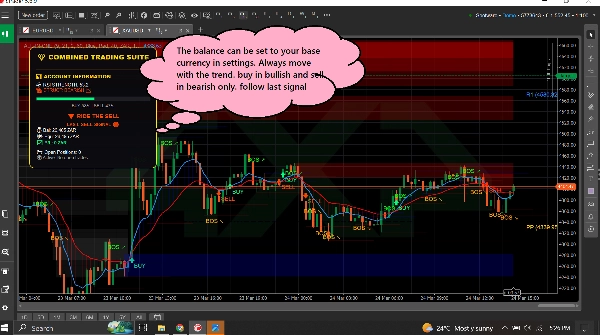
### 1. TREND DASHBOARD (Il rilevatore di trend)
**Cosa fa:** Ti dice in quale direzione si muove il mercato e quanto è forte il movimento.
**Cosa vedi:**
- **Linea blu** = Media mobile veloce (trend a breve termine)
- **Linea rossa** = Media mobile lenta (trend a lungo termine)
- **Nuvola blu** = Trend rialzista (prezzo in aumento)
- **Nuvola rossa** = Trend ribassista (prezzo in diminuzione)
- **Freccia verde** = Segnale di ACQUISTO
- **Freccia rossa** = Segnale di VENDITA
- **Barra RSI** = Mostra se il mercato è ipercomprato (troppo alto) o ipervenduto (troppo basso)
========================================================
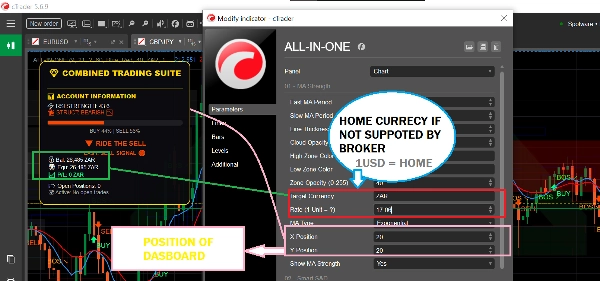
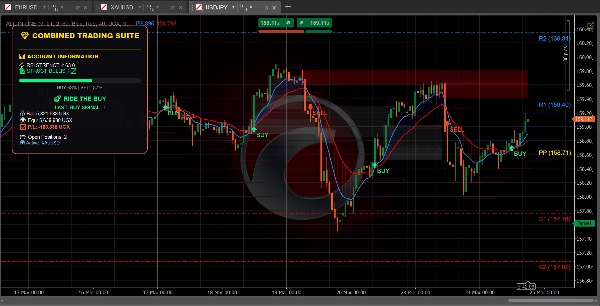
**Mostra anche:**
- Il saldo del tuo conto e il profitto/perdita
- Quante posizioni hai aperte
- Consigli testuali semplici come "SICURO PER ACQUISTARE" o "SEGUE L'ACQUISTO"
============================================================
### 2. ZONE DI OFFERTA E DOMANDA (Il rilevatore di livelli chiave)
**Cosa fa:** Trova livelli di prezzo importanti dove il mercato potrebbe invertire o fermarsi.
**Cosa vedi:**
- **Rettangoli blu** = Zone di domanda (aree dove entrano gli acquirenti - BUONO per comprare)
- **Rettangoli rossi** = Zone di offerta (aree dove entrano i venditori - BUONO per vendere)
- **Rettangoli grigi** = Zone testate (meno affidabili)
============================================================
**Come usarlo:**
- Prezzo che scende verso un rettangolo blu? Cerca di COMPRARE
- Prezzo che sale verso un rettangolo rosso? Cerca di VENDERE
- I rettangoli freschi (luminosi) funzionano meglio di quelli grigi
============================================================
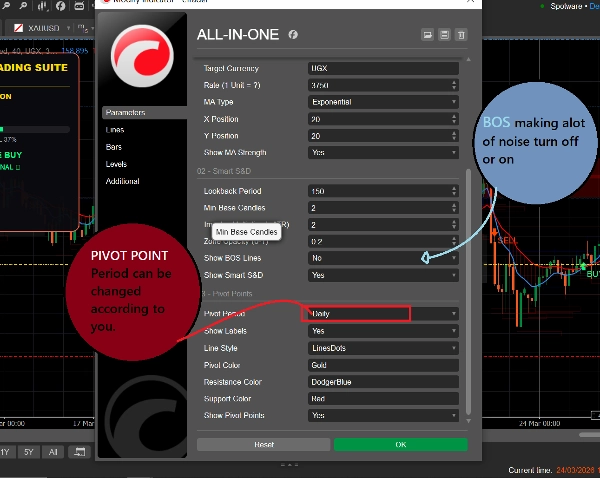
**Mostra anche:**
- **BOS ↗** = Il mercato ha rotto al rialzo, il trend potrebbe continuare verso l'alto
- **BOS ↘** = Il mercato ha rotto al ribasso, il trend potrebbe continuare verso il basso
============================================================
### 3. PIVOT POINTS (I livelli di supporto e resistenza)
**Cosa fa:** Calcola automaticamente i livelli di prezzo dove il mercato spesso si ferma o gira.
**Cosa vedi:**
- **Linea oro** = Punto pivot (livello centrale)
- **Linee blu** = Livelli di resistenza (il prezzo potrebbe scendere qui)
- **Linee rosse** = Livelli di supporto (il prezzo potrebbe salire qui)
============================================================
**Puoi scegliere:**
- **Giornaliero** = I livelli cambiano una volta al giorno
- **Settimanale** = I livelli cambiano una volta alla settimana
- **Mensile** = I livelli cambiano una volta al mese
- **15 minuti** = I livelli cambiano ogni 15 minuti (buono per trading veloce)
============================================================
## Come usarlo (semplice)
### Per trovare un trade di ACQUISTO:
1. Aspetta che il prezzo raggiunga un **rettangolo blu di domanda**
2. Controlla se la linea MA blu è sopra la linea MA rossa (trend rialzista)
3. I segnali dovrebbero essere seguiti solo se il mercato è nel trend giusto
============================================================
### Per trovare un trade di VENDITA:
1. Aspetta che il prezzo raggiunga un **rettangolo rosso di offerta**
2. Controlla se la linea MA rossa è sopra la linea MA blu (trend ribassista)
3. I segnali dovrebbero essere seguiti solo se il mercato è nel trend giusto
============================================================
### Per trovare trade veloci:
1. Usa i pivot points a 15 minuti per livelli precisi
2. Osserva le frecce BOS per la direzione del trend
3. Controlla la dashboard per la forza del mercato
4. Fai trade che corrispondono alla direzione
============================================================
## Cosa significano tutti i colori
| Colore | Cosa significa |
| 🟦 Blu | Segnali rialzisti / di acquisto / zone di domanda / pivot di resistenza |
| 🔴 Rosso | Segnali ribassisti / di vendita / zone di offerta / pivot di supporto |
| 🟨 Oro | Punto pivot (livello centrale) |
| ⚪ Grigio | Zone testate (già visitate) |
| 🟢 Freccia verde | Segnale di ACQUISTO |
| 🔴 Freccia rossa | Segnale di VENDITA |
============================================================
## Impostazioni semplici per principianti
============================================================
### Per trading veloce (Scalping):
- Periodo pivot: **15 minuti**
- MA veloce: **5**
- MA lenta: **13**
- Attiva: Tutti e tre gli strumenti
============================================================
### Per day trading:
- Periodo pivot: **Giornaliero**
- MA veloce: **9**
- MA lenta: **21**
- Attiva: Tutti e tre gli strumenti
============================================================
### Per trading a lungo termine:
- Periodo pivot: **Settimanale**
- MA veloce: **21**
- MA lenta: **55**
- Attiva: Trend Dashboard + Pivot Points
=========================================================
## Una regola da ricordare
=========================================================
**Non fare trading quando gli strumenti non sono d'accordo!**
Se la dashboard dice ACQUISTA, ma il prezzo è in una zona di offerta rossa - aspetta chiarezza.
Se la dashboard dice VENDI, ma il prezzo è in una zona di domanda blu - aspetta chiarezza.
I migliori trade avvengono quando TUTTI gli strumenti puntano nella stessa direzione.
============================================================
## Avvio rapido
1. Aggiungi l'indicatore al tuo grafico
2. Mantieni tutte le impostazioni di default per iniziare
3. Osserva come si comporta il prezzo sulle caselle e linee colorate
4. Dopo qualche giorno, regola le impostazioni per adattarle al tuo stile
5. Usa la dashboard per monitorare il tuo conto in tempo reale
============================================================
Ecco fatto! Tre strumenti, un indicatore, trading semplice.
Riepilogo
1. Trend Dashboard: Displays short-term (blue line) and long-term (red line) moving averages, colored clouds indicating uptrend (blue) or downtrend (red), buy (green arrow) and sell (red arrow) signals, and an RSI bar showing overbought or oversold conditions. It also shows account balance, open positions, and simple text advice.
2. Supply & Demand Zones: Highlights important price levels with blue boxes for demand zones (buying areas), red boxes for supply zones (selling areas), and gray boxes for tested zones (less reliable). It includes breakout signals (BOS arrows) indicating potential trend continuation.
3. Pivot Points: Automatically calculates support and resistance levels with a gold pivot point line, blue resistance lines, and red support lines. Users can select pivot periods from 15-minute to monthly intervals for different trading styles.
The indicator supports multiple markets including Forex, Crypto, Stocks, and Indices, and provides visual signals such as crossovers, breakouts, and level touches. It is designed for various trading styles, from scalping to long-term trading, with recommended settings for each. The tool emphasizes trading only when all three components align in direction to improve trade clarity and consistency.
Recensioni dei clienti
5 | 100 % | |
4 | 0 % | |
3 | 0 % | |
2 | 0 % | |
1 | 0 % |


