Descrizione
Heikin Ashi Structure Bias (Indicatore cTrader)
Zone di domanda e offerta automatiche con bias multi-timeframe.
Cosa fa – in parole semplici
Questo indicatore automaticamente:
- Legge l’azione del prezzo Heikin Ashi e rileva significativi cambi di pivot.
- Costruisce zone dinamiche di supporto e resistenza attorno a quei pivot, usando sia l’estremo della candela (wick) sia il corpo della candela (non solo linee casuali).
- Unisce intelligentemente le zone vicine così da mostrare livelli puliti e commerciabili invece di una foresta di linee orizzontali.
- Genera un chiaro bias rialzista o ribassista ogni volta che il prezzo rompe completamente l’ultima zona di supporto o resistenza.
- Ti mostra il bias per:
-
- Il tuo timeframe del grafico, e
- Un timeframe superiore opzionale (default H2) — senza disegnare confusione HTF sul tuo grafico.
Risultato: a colpo d’occhio ti dice dove sono i livelli reali e se il mercato sta attualmente tendendo verso l’alto o verso il basso.
Il problema che risolve
La maggior parte dei trader ha gli stessi problemi:
- Le linee di supporto/resistenza disegnate a mano sono:
-
- soggettive,
- incoerenti,
- e spesso esagerate.
- Semplici indicatori “zigzag + linea orizzontale”:
-
- non gestiscono correttamente la larghezza della zona,
- accumulano livelli uno sopra l’altro,
- o estendono le zone così tanto da coprire metà del grafico.
- Il bias è spesso “nella tua testa” – non qualcosa che puoi vedere chiaramente o usare in modo basato su regole.
Questo indicatore è costruito per:
- Trasformare la struttura Heikin Ashi in zone chiare e oggettive,
- Fornirti un trend/bias basato su regole basato su quelle zone,
- Mantenendo il grafico pulito e leggibile.
Come vengono costruite le zone (spiegazione per trader)
Per ogni pivot Heikin Ashi, l’indicatore considera una struttura di 3 candele:
- Quando HA cambia da rosso a verde, segna un pivot di supporto.
- Quando HA cambia da verde a rosso, segna un pivot di resistenza.
Poi costruisce la zona:
Zone di supporto
- Trova il wick più basso tra le 3 candele (vero estremo).
- Trova il minimo successivo più basso che sia ancora superiore a quell’estremo.
- Usa il corpo della candela (open/close) vicino a quel minimo interno per definire il lato “commerciabile” della zona.
- Zona di supporto finale:
-
- Fondo = wick estremo basso,
- Alto = livello interno basato sul corpo.
Zone di resistenza
- Trova il wick più alto tra le 3 candele.
- Trova il massimo successivo più alto che sia ancora inferiore a quell’estremo.
- Usa il corpo vicino a quel massimo interno.
- Zona di resistenza finale:
-
- Alto = wick estremo alto,
- Fondo = livello interno basato sul corpo.
Quindi ogni zona non è solo una banda arbitraria:
È un intervallo wick-corpo che rappresenta dove il prezzo è realmente stato respinto o invertito.
Logica di unione (perché il grafico resta pulito)
Zone dello stesso tipo (supporto con supporto, resistenza con resistenza):
- Sono trattate come unità su una linea temporale.
- Possono unirsi solo se si sovrappongono effettivamente nel prezzo.
- L’unione è strettamente locale:
-
- Una nuova zona può unirsi con:
-
- la zona più recente (una accanto all’altra), o
- la seconda zona più recente (+1 intervallo), e
- Un’ulteriore “ancora” dietro a quella se la nuova zona combinata ora si sovrappone alla struttura precedente.
Questo mantiene il comportamento intuitivo:
- Le zone non “ingoiano” tutta la storia.
- I livelli più vecchi sono rispettati ma non possono creare mega-zone giganti.
- La struttura locale come A–B–C o A–C+D è gestita in modo controllato.
Logica del bias (come si fa trading con esso)
Per ogni timeframe (principale e HTF):
- L’indicatore traccia l’ultima zona di supporto unita e l’ultima zona di resistenza unita.
- Poi, ad ogni candela chiusa:
-
- Se il prezzo chiude sopra l’ultima zona di resistenza → il bias diventa Rialzista.
- Se il prezzo chiude sotto l’ultima zona di supporto → il bias diventa Ribassista.
Memorizza:
- Il momento dell’ultimo cambio di bias,
- Il livello di prezzo al quale il prezzo ha rotto la zona.
Sul grafico, un piccolo pannello di testo mostra:
Bias Principale (H1): RialzistaCambio Principale (H1): 26/11 15:00 @1.08750
Se l’HTF è abilitato, vedrai anche qualcosa come:
Bias HTF (H2): RibassistaCambio HTF (H2): 25/11 08:00 @1.09200
Puoi anche abilitare un avviso sonoro quando il bias del timeframe principale cambia.
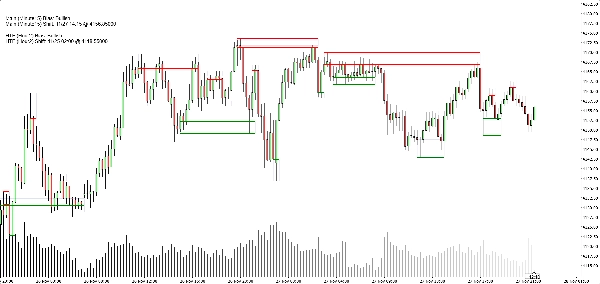
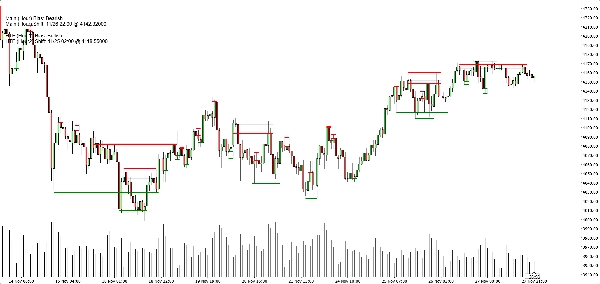
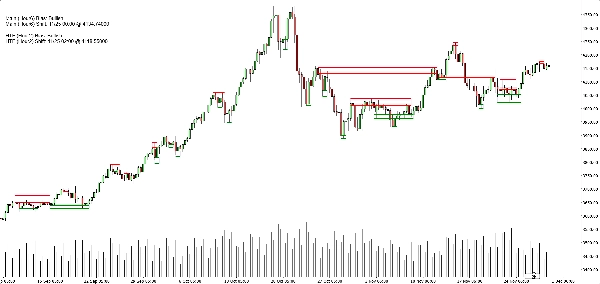
Cosa vedi sul grafico
- Zone di supporto:
-
- Linee base/trigger orizzontali verdi (opzionali),
- Un rettangolo blu navy morbido (opacità molto bassa) che mostra tutta la banda di supporto.
- Zone di resistenza:
-
- Linee rosse + rettangolo blu navy morbido per la banda.
- Interruttori di visualizzazione pulita:
-
- Mostra/nascondi zone di supporto,
- Mostra/nascondi zone di resistenza,
- Accendi/spegni i rettangoli pieni,
- Accendi/spegni le linee base/trigger,
- Accendi/spegni il pannello del bias.
Questo permette a diversi trader di scegliere tra:
- Un aspetto più minimalista (forse solo rettangoli), o
- Una vista più precisa (linee esatte visibili).
Casi d’uso tipici
Puoi posizionarlo come utile per:
- Filtraggio del trend
-
- Cercare acquisti solo quando entrambi i bias del TF principale e HTF sono rialzisti.
- Cercare vendite solo quando entrambi sono ribassisti.
- Entrate nelle zone
-
- Usare le zone come aree di interesse per:
-
- Ordini limite,
- Entrate di conferma (es. il prezzo ritorna in una zona rotta e viene respinto di nuovo),
- Posizionamento dello stop appena oltre la banda esterna.
- Analisi top-down
-
- Bias HTF (H2 di default) come quadro generale,
- Bias TF del grafico per il timing,
- Zone per livelli concreti di esecuzione.
Cosa NON è (importante per una vendita onesta)
- Non è un robot che fa trading automatico per te.
- Non è un segnale “santo graal” che garantisce profitto.
- È un motore di struttura e bias:
-
- Definisce oggettivamente le zone,
- Definisce oggettivamente trend/bias basato su quelle zone,
- Lascia la gestione effettiva del trading al trader/strategia.
Riepilogo
It provides a rule-based bullish or bearish bias by tracking price breaks above resistance or below support zones on both the current chart timeframe and an optional higher timeframe. This bias is displayed on a built-in dashboard panel, with optional sound alerts for bias changes.
The indicator works across all timeframes and markets where price forms swings, including forex, crypto, stocks, and futures. It features customizable lookback periods, automatic cleanup of old zones, and toggles for display elements to suit different trader preferences.
Typical uses include trend filtering by aligning biases across timeframes, identifying zone entries for limit or confirmation orders, and supporting top-down analysis. The tool timestamps and sequences pivots and bias shifts, facilitating automation or journaling. It is a structure and bias engine that aids traders in objectively defining market levels and trends while maintaining chart clarity.
Recensioni dei clienti
5 | 33 % | |
4 | 67 % | |
3 | 0 % | |
2 | 0 % | |
1 | 0 % |