
AllPattern
Indicatore
362 download
Versione 1.0, Aug 2025
Windows, Mac
5.0
Recensioni: 2
Descrizione
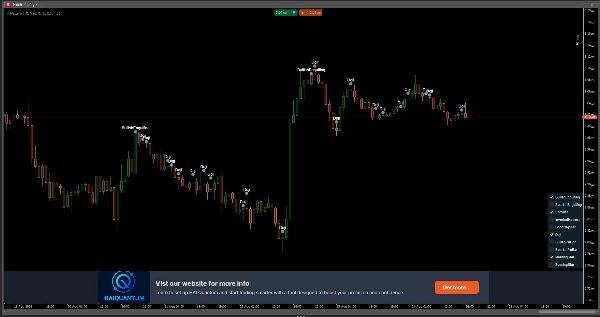
🔍 Scopri tutti i pattern a candela… Assolutamente gratis! 😀
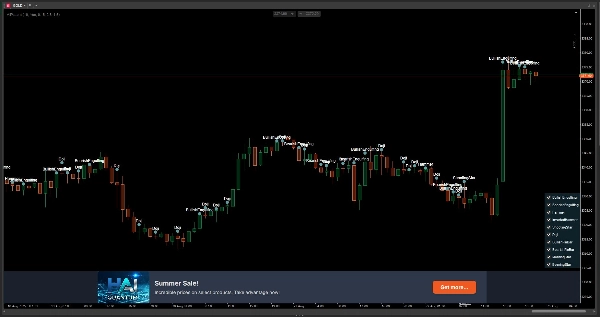
Con il nostro strumento, puoi visualizzare tutti i principali pattern a candela direttamente sul tuo grafico. Da Doji a Bullish Engulfing, inclusi Hammer, Shooting Star, e molti altri.
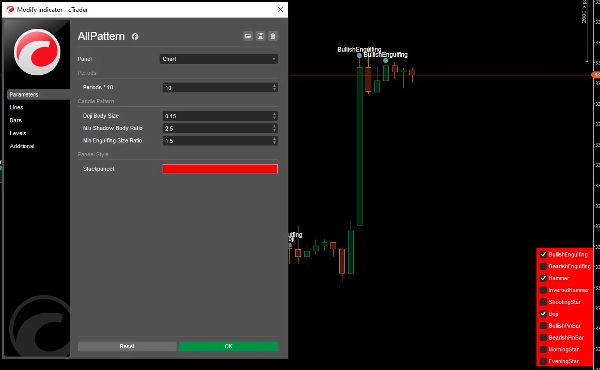
📌 Come funziona? È semplice: usa il pannello a destra per scegliere esattamente quali pattern vuoi visualizzare. Attivali o disattivali per adattarli alla tua strategia di trading.
💸 La parte migliore? È completamente gratuito! Nessun abbonamento, nessun limite—solo analisi visiva pura.
Riepilogo
Profilo indicatore
Recensioni dei clienti
5.0
Recensioni: 2
5 | 100 % | |
4 | 0 % | |
3 | 0 % | |
2 | 0 % | |
1 | 0 % |
Recensioni dei clienti
October 8, 2025
Chart artist’s dream! 🧠 Spots triangles, wedges, flags — all in one go. Saves tons of time on manual pattern drawing. Great helper, but always double-check those breakouts!
Discussioni
Domande frequenti
BTCUSD
Forex
Signal
Breakout
Indices
EURUSD
Commodities
GBPUSD
NZDUSD
Martingale
Prop
Scalping
Crypto
Grid
Stocks
AI
XAUUSD
NAS100
USDJPY
I prodotti disponibili tramite cTrader Store, inclusi bot di trading, indicatori e plugin, sono forniti da sviluppatori terzi e resi disponibili esclusivamente a scopo informativo e di accesso tecnico. cTrader Store non è un broker e non fornisce consulenze in materia di investimento, raccomandazioni individualizzate o garanzie di risultati futuri.


Prezzo
147
Vendite
11.17K
Installazioni gratuite