
설명
RSI에 적용되는 복합 지수를 생각하는 가장 좋은 방법은 RSI를 Windows 3.0으로, 복합 지수를 Windows 10으로 생각하는 것입니다. Constance Brown은 RSI가 다이버전스를 생성하고 감지하지만, 그 정확도가 충분하지 않다는 것을 발견했습니다. 이것은 약간 모순적이지만, RSI는 모멘텀 계산이 전혀 첨부되지 않은 모멘텀 지표입니다. RSI는 중요한 움직임을 상당 부분 놓치고 심지어 잘못된 신호도 생성합니다. Constance Brown이 RSI에 한 일은 RSI 자체 내에 모멘텀 계산을 입력한 것입니다. 이 지수는 RSI의 정규화 범위 제한을 제거합니다. 즉, 0-100 범위에 묶여 있지 않습니다.
RSI와 복합 지수 함께 사용하기
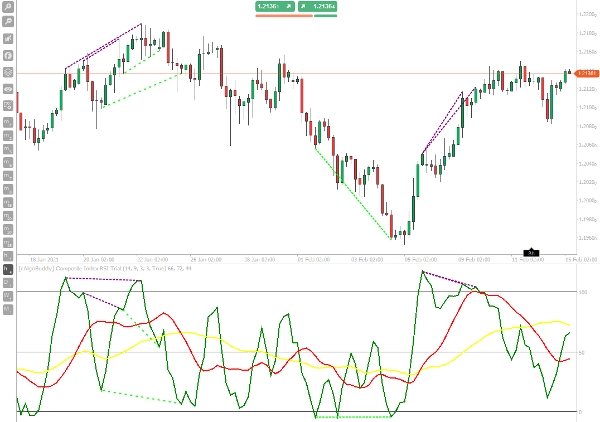
Constance Brown이 복합 지수와 함께 사용한 전략 중 하나는 복합 지수를 RSI와 비교하는 것이었습니다. 다이버전스를 찾을 때 우리는 강세 다이버전스와 같은 것을 찾습니다. 강세 다이버전스는 가격이 더 높은 고점을 만들지만 오실레이터는 더 낮은 고점을 나타낼 때 발생합니다. RSI와 복합 지수를 함께 사용할 때, RSI를 가격 차트처럼 취급하고 복합 지수를 오실레이터로 봅니다.
이 지표는 다이버전스를 감지하기 위한 내부 정상 RSI 라인을 가지고 있으므로 작업이 이미 완료되어 있습니다. 다이버전스 신호를 다른 오실레이터와 마찬가지로 거래하세요.
복합 지수의 주요 특징은 명확한 작동 신호와 함께 모멘텀을 나타내는 것입니다. 따라서 RSI가 과매수 또는 과매도 구역에 진입할 때, 복합 지수가 이동평균선과 반대 방향으로 교차하는 것은 좋은 거래 신호를 나타냅니다. 그런 다음, 오실레이터 모멘텀과 지지선 및 저항선에서 가격의 움직임이 결합되어 매우 흥미롭고 성공적인 거래 논리를 형성하며, 이는 암호화폐 거래에도 잘 맞습니다.
사용 방법
복합 지수 전략은 지지 및 저항 수준과 상대 강도 지수 및 복합 지수의 과매수 및 과매도 수준의 조합을 기반으로 하는 모멘텀 가격 행동 전략입니다. 이 거래 전략에서 복합 지수는 최종 진입 타이밍이기도 합니다.
시간 프레임: H1 이상, 항상 RSI와 함께 사용하세요.
매수
- 가격이 지지선에서 반등합니다.
- 복합 RSI 이동평균선이 50 레벨 아래에 있고 빠른 MA(빨강)가 느린 MA(노랑)보다 낮습니다.
- RSI가 저점을 만들고 값이 30 근처이거나 그 이하이며 복합 지수도 저점을 가집니다.
- 복합 지수가 이동평균선을 상향 돌파하는 순간 매수합니다.
매도
- 가격이 저항선에서 반등합니다.
- 복합 이동평균선이 50 레벨 위에 있고 빠른 MA(빨강)가 느린 MA(노랑)보다 높습니다.
- RSI가 고점을 만들고 값이 70 근처이거나 그 이상이며 복합 지수도 고점을 가집니다.
- 복합 지수가 이동평균선을 하향 돌파할 때 매도합니다(이것이 시장 진입 타이밍입니다).
요약
고객 리뷰
5 | 0 % | |
4 | 100 % | |
3 | 0 % | |
2 | 0 % | |
1 | 0 % |


!["High-Low Divergence [Iridio Capital]" 로고](https://cdn.ctrader.com/image/webp/443c4661-7abb-40f1-842f-4b6ec560649b_40914)


