
ATR on Chart
Indicador
250 descargas
Versión 1.0, Sep 2025
Windows, Mac
Descripción
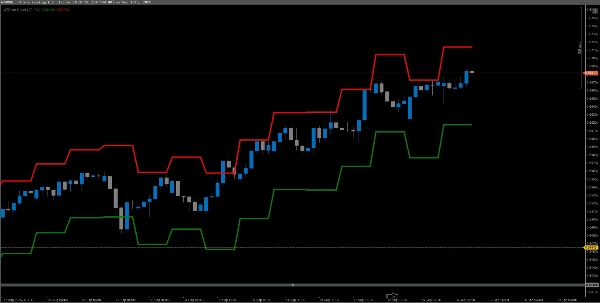
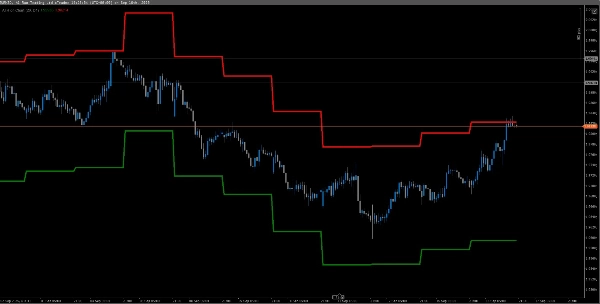
Muestra el rango verdadero promedio. Traza el ATR en el gráfico para una visualización fácil, el marco de tiempo predeterminado es Diario pero puedes modificarlo.
Resumen
Perfil del indicador
Valoraciones de clientes
0.0
Valoraciones: 0
Valoraciones de clientes
Este producto todavía no se ha valorado. ¿Ya lo ha probado? Sea el primero en informar a otros.
Conversación
Preguntas frecuentes
BTCUSD
Forex
Signal
Indices
EURUSD
Commodities
GBPUSD
Crypto
XAUUSD
ATR
USDJPY
Los productos disponibles a través de cTrader Store, incluidos bots, indicadores y plugins para operar, son proporcionados por desarrolladores de terceros y están disponibles únicamente con fines informativos y de acceso técnico. cTrader Store no es un bróker, por lo que no proporciona asesoramiento de inversión, recomendaciones personales ni ninguna garantía de rentabilidad futura.


![Logotipo de "[Hamster-Coder] Moving Average MTF"](https://cdn.ctrader.com/image/webp/b11b98b1-194d-4b8e-b00e-d611826ad159_31226)


Precio
Desde 11/09/2025
250
Instalaciones gratis