
الوصف
مؤشر اختراق التقلب - محرك تقلب هوكس
هذا المؤشر مصمم لتوفير السياق، وليس لاتخاذ إجراءات تداول فورية. يساعدك مكون التقلب على معرفة متى تتغير ظروف السوق - فترات التقلب المنخفض غالبًا ما تسبق تحركات كبيرة، وفترات التقلب العالي تنفد في النهاية. يحافظ مكون EWMA على توجيهك مع الاتجاه المتطور ويسلط الضوء على متى يبتعد السعر عنه.
اجمع بين هذين المنظورين - نظام التقلب وسياق الاتجاه - مع منهجية التداول الخاصة بك وحكمك. يعرض لك المؤشر البيئة - وأنت تقرر ما يجب فعله فيها.
الإصدار 2.0
مفتوح للتحديثات المستقبلية
-----------------------------------------------------------------------------------------------------------------------------------------------------------------------
نظرة عامة
-----------------------------------------------------------------------------------------------------------------------------------------------------------------------
يجمع هذا المؤشر بين مكونين مميزين لمساعدة المتداولين على تحديد أنظمة التقلب وظروف الاتجاه في نفس الوقت.
يستخدم المكون الأول عملية هوكس لاكتشاف التغيرات في تقلب السوق. على عكس مؤشرات التقلب التقليدية، لا يتنبأ بالاتجاه - بل يشير فقط إلى متى ينتقل السوق من ضغط هادئ إلى تقلب نشط، أو العكس. فكر فيه ككاشف حالة التقلب: يخبرك متى ترتفع الحرارة أو تنخفض، لكنه لا يخبرك في أي اتجاه سيتحرك السعر.
يضيف المكون الثاني نظام EWMA مزدوج (المتوسط المتحرك المرجح أسيًا) الذي يُعرض على مخطط السعر الخاص بك. يمنحك هذا سياق الاتجاه باستخدام تقاطع متوسط متحرك سريع وبطيء، مع طبقة إضافية من تلوين الشموع لتوضيح متى ينحرف السعر عن الاتجاه.
-----------------------------------------------------------------------------------------------------------------------------------------------------------------------
كيف يعمل
-----------------------------------------------------------------------------------------------------------------------------------------------------------------------
كشف التقلب: يستخدم المؤشر مقياس تقلب باركنسون العالي-المنخفض — وهي طريقة أكثر كفاءة من طريقة ATR القياسية لأنها تستخدم نطاق الشمعة الكامل. يتم تغذية هذا التقلب المُطبع في حساب عملية هوكس، والتي تُقارن بعد ذلك مع عتبات ديناميكية قائمة على الكوانتايل.
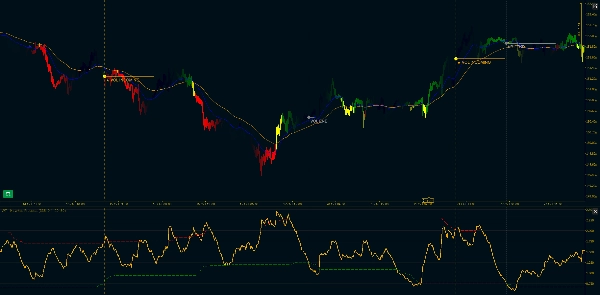
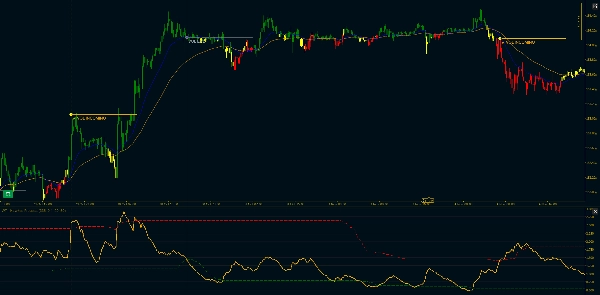
عندما يكسر التقلب العتبة العليا بعد فترة من الضغط، تحصل على إشارة "VOL INCOMING". وعندما ينخفض مرة أخرى تحت العتبة السفلى، ترى "VOL END". هذه ليست إشارات دخول — إنها تغييرات في نظام التقلب. السوق إما يستيقظ أو ينام.
سياق الاتجاه: يظهر متوسطان متحركان مرجحان أسيًا (سريع وبطيء) على المخطط الرئيسي للسعر. المتوسط السريع أزرق، والمتوسط البطيء برتقالي. عندما يكون السريع فوق البطيء، يكون الاتجاه صاعدًا. وعندما يكون السريع تحت البطيء، يكون الاتجاه هابطًا.
مرشح الانحراف: هنا يصبح الأمر مثيرًا. أحيانًا يبتعد السعر عن الاتجاه بشكل كبير. عندما تكون الشمعة بأكملها (الفتح، الأعلى، الأدنى، الإغلاق) تحت المتوسط السريع خلال اتجاه صاعد، أو فوقه خلال اتجاه هابط، تتحول الشمعة إلى اللون الأصفر. هذا مرشح صارم — إذا لمس حتى الفتيل المتوسط السريع، تبقى الشمعة بلون الاتجاه العادي.
غالبًا ما تظهر الشموع الصفراء عند التصحيحات أو نقاط النفاد، لكن تذكر: إنها لا تخبرك بما سيأتي بعد ذلك، فقط أن السعر قد انفصل مؤقتًا عن خط الاتجاه.
-----------------------------------------------------------------------------------------------------------------------------------------------------------------------
الميزات الرئيسية
-----------------------------------------------------------------------------------------------------------------------------------------------------------------------
مكون التقلب:
- تطبيع تقلب باركنسون العالي-المنخفض (أكثر كفاءة من طريقة ATR القياسية)
- حساب عملية هوكس مع تلاشي قابل للتعديل (معامل كابا)
- عتبات ديناميكية قائمة على الكوانتايل (نسب مئوية قابلة للتخصيص)
- علامات بصرية: "VOL INCOMING" عند اختراقات التقلب، "VOL END" عند الضغط
- تصفية الاستمرار: يتم تمييز أول اختراق فقط، وليس كل ارتفاع مفاجئ
- خطوط اتجاه أفقية وعلامات عمودية اختيارية
مكون اتجاه EWMA:
- حساب EWMA متوافق مع Pandas (صيغة adjust=True)
- خطوط MA السريع والبطيء معروضة على مخطط السعر الرئيسي
- أطوال النطاق القابلة للتخصيص (الافتراضي: 20/50)
- دعم فترات الحد الأدنى (يمنع الإخراج حتى تتوفر بيانات كافية)
- خيار تجاهل NA للتعامل مع الفجوات
- نظام شموع بثلاثة ألوان: أخضر (اتجاه صاعد)، أحمر (اتجاه هابط)، أصفر (انحراف)
خيارات التخصيص:
- فترة باركنسون (نظرة خلفية لحساب التقلب)
- كابا هوكس (معدل التلاشي، يؤثر على الحساسية)
- فترة النظرة الخلفية للكوانتايل
- عتبات التقلب المنخفض والعالي (نسب مئوية)
- تبديل التسنين وطول الجزء
- نطاق سريع وبطيء للمتوسطات المتحركة
- ألوان صاعدة، هابطة، وانحراف
- طول امتداد خط الاتجاه
- إظهار/إخفاء العلامات العمودية
----------------------------------------------------------------------------------------------------------------------------------------------------------------------------
ملاحظة فنية: يستخدم مكون عملية هوكس حسابًا أسيًا تكراريًا محسنًا للاستخدام في الوقت الحقيقي. تنفيذ EWMA يتطابق مع سلوك Pandas للاتساق مع الاختبار الخلفي القائم على بايثون. كلا المكونين يحسبان فقط على الأشرطة المغلقة لتجنب إعادة الرسم.
الملخص
تقييمات العملاء
5 | 100 % | |
4 | 0 % | |
3 | 0 % | |
2 | 0 % | |
1 | 0 % |


