
Açıklama
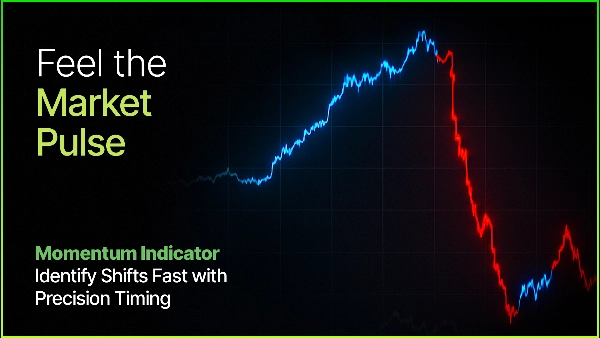
Genlik Momentum Etiketi — Volatilite ile Güçlendirilmiş Uyarlanabilir Trend Tespiti
Genlik Momentum Etiketleyici birden fazla gelişmiş kavramı birleştirir:
- Rejim Tespiti — Gerçek trend aşamalarını tanımlar
- Volatilite Uyumu — Mevcut piyasa koşullarına kendini ayarlar
- Dinamik VWAP — Anlamlı geri çekilme ve devam seviyelerini vurgular
- Roll Spread Tahmincisi — Trendler sırasında optimal yeniden giriş noktalarını sinyaller
- OPTİMİZASYON MODÜLÜ — Kendini Optimize Etme Özelliği ile**
Bu, sürekli manuel ayar yapmaya gerek kalmadan netlik, uyarlanabilirlik ve uygulanabilir işlem bölgeleri sunan zeki, kendini ayarlayan bir gösterge oluşturur.
Nedir?
Genlik Momentum Etiketleyici, rejim tespiti göstergesidir ve piyasanın yukarı veya aşağı momentum aşamalarına ne zaman girdiğini veya çıktığını gerçek zamanlı olarak belirler.
Geleneksel hareketli ortalama kesişimlerinin aksine, fiyat yer değiştirmesi ve dönüş gücünü değerlendirerek gerçek momentum değişimlerini ölçer.
Temel Soru
Piyasa şu anda bir momentum aşamasında mı — ve hangi yönde?
Bunu cevaplamak için gösterge şunları takip eder:
- Genlik — fiyatın ne kadar hareket ettiğini;
- Sıra — yüksek ve düşüklerin hangi sırayla gerçekleştiğini.
Güçlü bir hareketi anlamlı bir dönüş takip ettiğinde yeni bir momentum rejiminin başlangıcı işaretlenir.
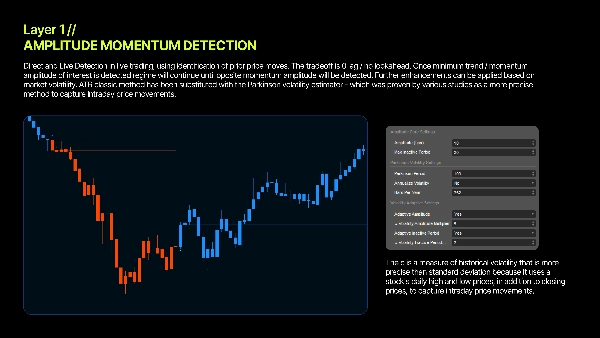
Nasıl Çalışır
1. Salınımı Ölç
Gösterge en yüksek ve en düşük fiyat uçlarını sürekli günceller.
Aralarındaki fark —genlik— piyasanın mevcut salınım büyüklüğünü tanımlar.
2. Dönüşü Tespit Et
- Güçlü bir yükselişi takip eden keskin düşüş → **Yukarı yönlü momentum**
- Güçlü bir düşüşü takip eden keskin yükseliş → **Aşağı yönlü momentum**
3. Önemini Onayla
Sadece volatiliteye uyarlanmış eşik değerini aşan dönüşler geçerli sinyal tetikler.
4. Tükenmeyi Tespit Et
Fiyat ilerlemeyi durdurursa, gösterge momentum tükenmesini tanır ve nötr konuma döner.
Parkinson Volatilitesi — Uyarlanabilir Eşikler
Çoğu gösterge sabit parametreler kullanır. Bu gösterge ise otomatik olarak uyum sağlar. Parkinson Volatilitesi—ki bu, gün içi yüksek/düşük aralıklarını içerir— kullanılarak gösterge, gerçek piyasa koşullarına göre hassasiyeti ayarlar. Sonuç: sakin ve volatil ortamlarda tutarlı performans. (İstatistiksel olarak ATR Yönteminden daha verimli olduğu kanıtlanmıştır)
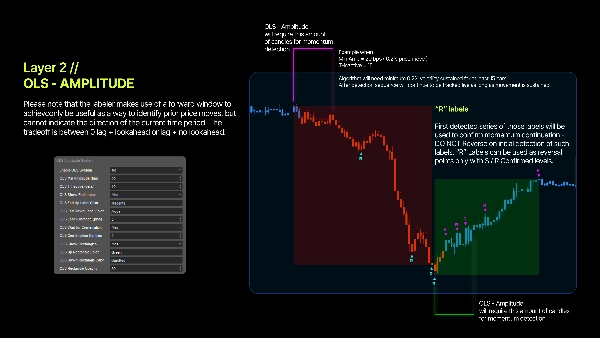
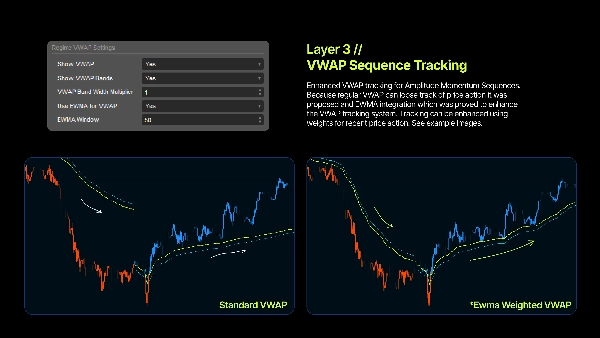
Rejim VWAP — Yeniden Giriş için Dinamik Seviyeler
Bir rejim aktif olduğunda, gösterge o trende özgü bir VWAP hesaplar ve Dinamik Destek ve Dinamik Direnç Seviyeleri sağlar. Kurumlar VWAP'a büyük ölçüde güvenir ve fiyat genellikle etrafında tepki verir—bu da geri çekilme girişleri için idealdir.
EWMA Modu
EWMA'yı etkinleştirerek, son fiyatlara daha fazla ağırlık verilir ve daha yumuşak, daha duyarlı bir VWAP eğrisi oluşturulur. Uzun trendlerde yeniden girişleri belirlemek için mükemmeldir.
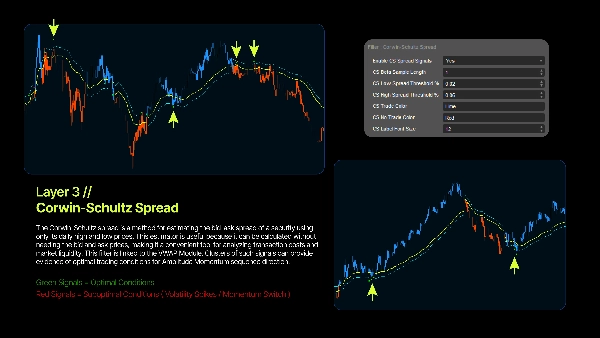
Roll Spread Tahmincisi - Yeniden Giriş için Dinamik Filtre
Roll spread tahmincisi, gözlemlenen işlem fiyatlarından teklif-talep farkını tahmin etmek için kullanılan bir yöntemdir; genellikle fiyat değişikliklerinin seri kovaryansı kullanılır. Roll tarafından geliştirilmiş olup, ardışık işlemlerin teklif ve talep fiyatları arasında değiştiğini ve yeni bilgilerin "gerçek" fiyatı sürekli hareket ettirmediğini varsayar. Basit ve temel olmakla birlikte, orijinal yöntem aşağı yönlü yanlılık ve belirli veri setlerinde kötü performans gibi sorunları ele almak için geliştirilmiştir. Tahminci, yeni bilgi yayınlanmadığı sürece fiyatların sadece teklif ve talep arasında dalgalanacağını varsayar. Alım ve satım işlemlerinin eşit olasılıkla gerçekleştiği kabul edilir.
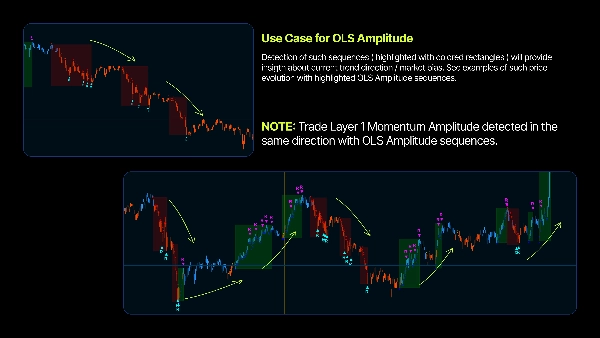
Kullanım Faydaları
1. Nesnel Trend Tanımlaması - Trend çizgileri yok. Tahmin yok. Matematik rejimi tanımlar.
2. Volatiliteye Uyarlanabilir - Parkinson Volatilitesi kullanarak değişen koşullara otomatik uyum sağlar.
3. Net Giriş Bölgeleri - Rejim VWAP seviyeleri sezgisel geri çekilme ve ekleme alanlarını belirlemeye yardımcı olur.
4. Tanımlı Rejim Sınırları - Momentumun ne zaman başladığını ve ne zaman bittiğini tam olarak bilin.
5. Çoklu Zaman Dilimi Uyumluluğu - Baz puan normalizasyonu herhangi bir grafikte tutarlı davranış sağlar.
Nicel Temel
Logaritmik Getiriler
Logaritmik getiriler kullanmak simetri sağlar ve momentum ölçümünü matematiksel olarak sağlam kılar.
Baz Puanlar
Tüm hesaplamalar standartlaştırılmış bps birimleri (1 bps = %0,01) kullanır, bu da varlıklar arası tutarlılık sağlar.
Geri Çekilme Tespiti
Momentum değişimleri, güçlü yönlü hareketleri anlamlı karşı hareketler (V şeklinde dönüşler) takip ettiğinde tanımlanır.
Sentetik Hacim
Aralık ve gövde tabanlı sentetik hacim, herhangi bir sembol için VWAP doğruluğunu sağlar.
⎽⎽⎽⎽⎽⎽⎽⎽⎽⎽⎽⎽⎽⎽⎽⎽⎽⎽⎽⎽⎽⎽⎽⎽⎽⎽⎽⎽⎽⎽⎽⎽⎽⎽⎽⎽⎽⎽⎽⎽⎽⎽⎽⎽⎽⎽⎽⎽⎽⎽⎽⎽⎽⎽⎽⎽⎽⎽⎽⎽⎽⎽⎽⎽⎽⎽⎽⎽⎽⎽⎽⎽⎽⎽⎽⎽⎽⎽⎽⎽⎽⎽⎽⎽⎽⎽⎽⎽⎽⎽⎽⎽⎽⎽⎽⎽⎽⎽⎽⎽⎽⎽⎽⎽⎽⎽⎽⎽⎽⎽⎽⎽
Bu araç sadece eğitim ve bilgilendirme amaçlıdır. Yatırım tavsiyesi değildir. Ticaret risk içerir ve kayıplar yatırılan tutarı aşabilir. Geçmiş performans gelecekteki sonuçları garanti etmez. Tüm ticaret kararlarından yalnızca siz sorumlusunuz. Oluşturan kişi, göstergenin kullanımından kaynaklanan finansal kayıplardan sorumlu değildir. Ticaret yapmadan önce her zaman kendi analizlerinizi yapınız.
Özet
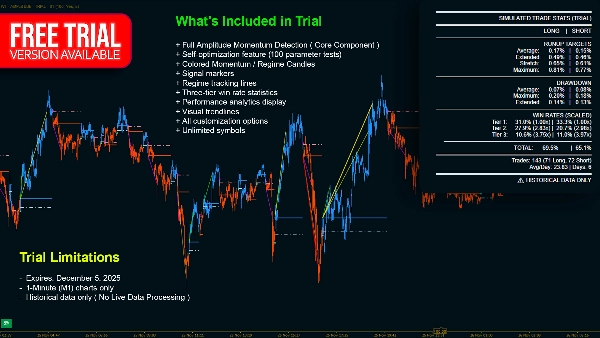
Key features include:
- **Regime Detection:** Pinpoints market entry and exit points for momentum trends.
- **Volatility Adaptation:** Uses Parkinson Volatility to self-tune sensitivity based on current market conditions, ensuring consistent performance across varying volatility.
- **Dynamic VWAP:** Calculates a volume-weighted average price specific to each trend regime, providing dynamic support and resistance levels for pullback and continuation entries.
- **Roll Spread Estimator:** Estimates bid-ask spreads to signal optimal re-entry points during trends.
- **Self-Optimization Module:** Automatically adjusts parameters without manual intervention.
The indicator operates by continuously tracking price extremes to measure swing amplitude, detecting significant reversals that exceed volatility-adjusted thresholds, and identifying momentum exhaustion when price progression stalls. It uses logarithmic returns and basis-point normalization for mathematically robust, cross-asset consistency. Synthetic volume calculations enhance VWAP accuracy across symbols.
This tool supports multiple markets including Forex, stocks, indices, commodities, and cryptocurrencies, and is compatible with various timeframes. It outputs visual signals and filters to assist traders in objective trend identification and clear entry zone determination.
Müşteri değerlendirmeleri
5 | 75 % | |
4 | 25 % | |
3 | 0 % | |
2 | 0 % | |
1 | 0 % |


!["Smart Money Concepts (SMC) [Iridio Capital]" logosu](https://cdn.ctrader.com/image/webp/28b69fd1-ef54-4bed-9487-07e78e883be4_40934)


