
Opis
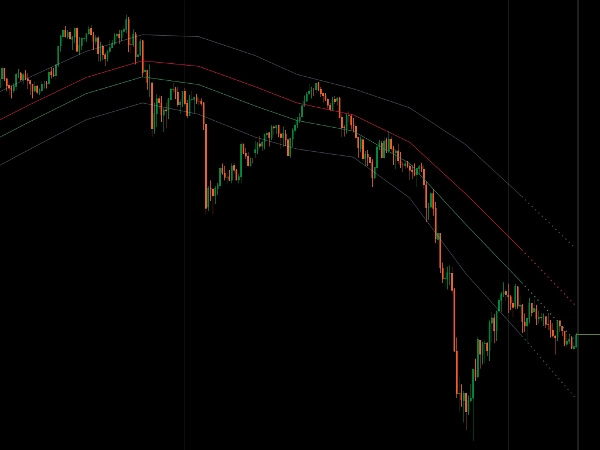
Dynamiczny kanał cenowy wykorzystujący średnie kroczące na wszystkich czterech cenach OHLC dla pełnej analizy struktury rynku.
Stosuje wybrany typ MA (Prosta, Wykładnicza, Wildera, Skalowana odchyleniem, SuperSmoother, Hull) do granic High/Low, kierunkowego biasu Open/Close oraz linii równowagi Median dla spójnej wizualizacji kanału.
Wbudowane strefy odwrócenia Fibonacciego (38,2%, 61,8%), podwójna warstwa wygładzania dla SMA/EMA tworząca ultra-czyste kanały, wyświetlanie wieloczasowe z tradycyjnym trybem schodkowym lub ukośnymi liniami trendu, inteligentne projekcje oparte na momentum oraz wykrywanie odrzuceń granic zapewniają kompleksową strukturę kanału dla traderów celujących w odwrócenie do średniej i ocenę siły trendu w różnych ramach czasowych.
CECHY
Kompletna struktura cenowa
- High/Low definiują granice kanału
- Open/Close pokazują kierunkowy bias
- Linia Median: poziom 50% pomiędzy High/Low — prawdziwe centrum równowagi rynku
- Cztery ceny współpracujące, aby pokazać pełny obraz rynku
Wbudowane strefy odwrócenia
- Poziomy Fibonacciego 38,2% i 61,8% oznaczają statystycznie istotne obszary cofnięcia
- Dynamiczne strefy dostosowujące się do ruchu cen
- Wyraźne punkty odniesienia wejścia i wyjścia
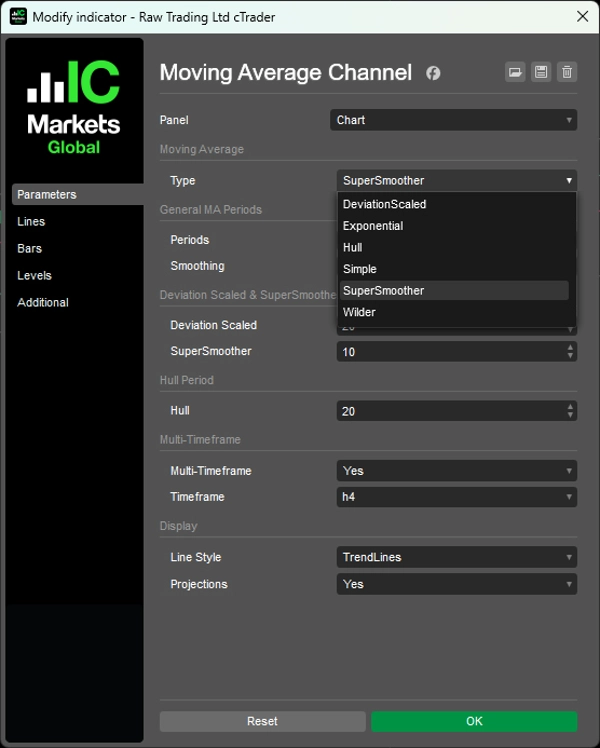
6 typów średnich kroczących
- Prosta, Wykładnicza, Wildera, Skalowana odchyleniem, SuperSmoother, Hull
- Podwójne wygładzanie dla SMA/EMA: Okres + dodatkowa warstwa wygładzania dla ultra-czystych kanałów
- Zaawansowane algorytmy: Skalowana odchyleniem dostosowuje się do zmienności, SuperSmoother usuwa opóźnienie, Hull podkreśla ostatnie ruchy cen
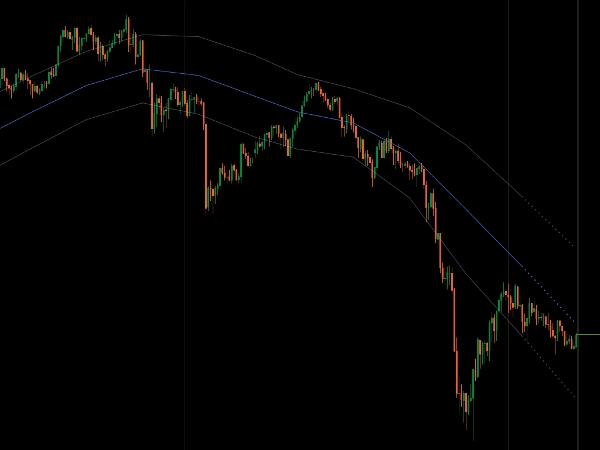
Wieloczasowe z liniami trendu
- Wyświetl kanał wyższego interwału na wykresach niższego interwału
- Dwa tryby wyświetlania: tradycyjne linie schodkowe lub ukośne linie trendu (tylko MTF)
- Linie łączą zamknięcia świec MTF dla czystej ukośnej struktury
- Inteligentne projekcje pokazują, dokąd zmierza kanał na podstawie aktualnego momentum
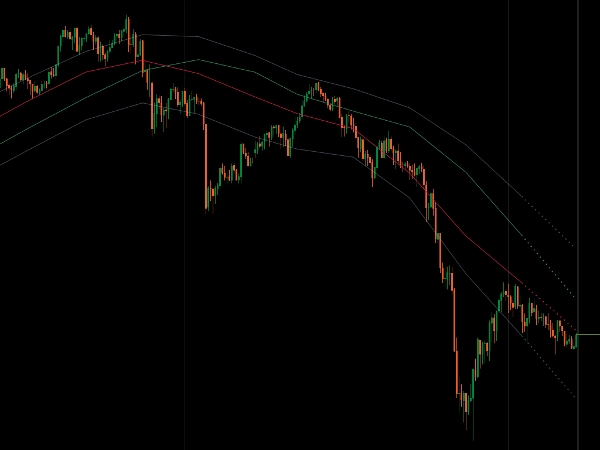
Czysty system wizualny
- Nachylenie kanału pokazuje momentum
- Pozycja ceny pokazuje siłę trendu
- Odrzucenia granic sygnalizują potencjalne odwrócenia
- Jeden wskaźnik do pełnej analizy struktury rynku
__________________________________________________________________________________________
WIĘCEJ DARMOWYCH WSKAŹNIKÓW
Odkryj szeroki zakres narzędzi analizy rynku — od struktury i wolumenu po regresję, zmienność i niestandardowe ramy czasowe.
Kod źródłowy jest dostępny w repozytorium GitHub repository.
Wszystko darmowe do użytku. Ale jeśli chcesz wesprzeć kawą, możesz to zrobić tutaj.
Wsparcie/Oporność
Wolumen
- Volume Activity Profiler
- Volume Efficiency Analyzer
- Volume Profile Analytics
- Volume Profile - Updated
- Volume Spread Analysis
- VWAP (Volume Weighted Average Price)
Średnie kroczące
- SSL Channel
- Anchored Moving Average
- Deviation-Scaled Moving Average
- Gann High Low Activator
- Instantaneous Trendline
- Kaufman Adaptive MA with Trend Vision
- Moving Average Channel
- Moving Averages Suite
- Trend Channel Moving Average
Narzędzia/Niestandardowe
Oparte na regresji
Zmienność
Oscylatory
__________________________________________________________________________________________
ZASTRZEŻENIE
Trading wiąże się z ryzykiem. Ten wskaźnik jest przeznaczony wyłącznie do analizy technicznej — zawsze stosuj odpowiednie zarządzanie ryzykiem i handluj odpowiedzialnie.
OPINIE I ULEPSZENIA
Jeśli masz sugestie, prośby o funkcje lub pomysły na ulepszenia, zostaw komentarz na karcie Dyskusja. Twoja opinia pomaga ulepszyć wskaźnik dla wszystkich.
Podsumowanie
The indicator incorporates built-in Fibonacci reversion zones at 38.2% and 61.8%, which dynamically adjust with price movement to highlight significant pullback areas and provide clear entry and exit reference points. It supports multi-timeframe analysis, allowing higher timeframe channels to be displayed on lower timeframe charts, with two visualization modes: traditional stairstep lines or diagonal trendlines connecting multi-timeframe bar closes. Smart momentum-based projections indicate potential channel direction, while boundary rejection detection signals possible reversals.
This tool offers a cohesive visual system where channel slope reflects momentum and price position indicates trend strength, enabling traders to assess trend direction, momentum shifts, and mean reversion zones across various markets including Forex, Indices, Commodities, Crypto, and Stocks.


![Logo „[CB] Pivot Points Pro”](https://cdn.ctrader.com/image/webp/43463c82-67b0-4f10-a4ba-901bba091d81_32594)


