Opis
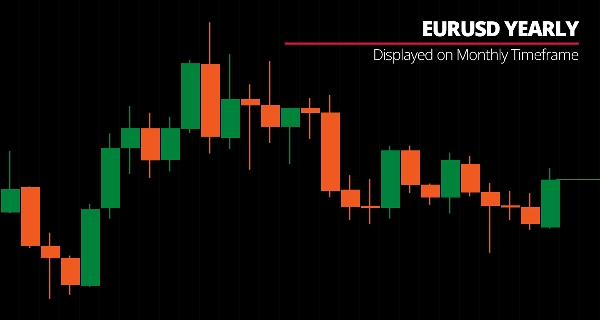
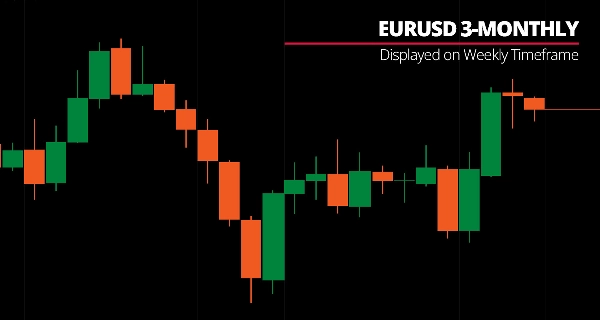
Wyświetlaj natywne interwały czasowe cTrader oraz niestandardowe okresy (5H, 7H, 9H, 4-dniowe, 2-tygodniowe, 3-miesięczne, roczne) jako niestandardowe świece z przełącznikiem interwałów opartym na toggle.
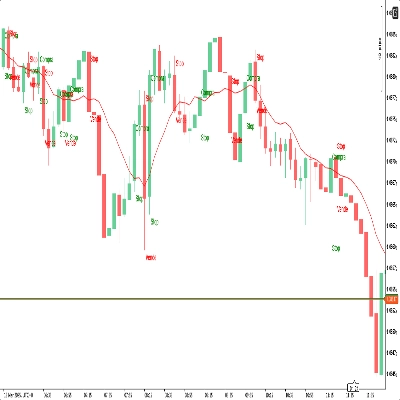
Renderuje niestandardowe świece okresowe na dowolnym wykresie — od słupków 25-minutowych do okresów rocznych — z przyciskami przełączania interwałów dla szybkiego przełączania między okresami.
Kompleksowe opcje okresów (niestandardowe minuty/godziny/dni/tygodnie/miesiące), wizualne świece bycze/niedźwiedzie z konfigurowalną grubością knotów oraz kontrolki toggle do szybkiego przełączania interwałów zapewniają elastyczną analizę wielointerwałową dla traderów potrzebujących okresów pomiędzy standardowymi interwałami wykresów.
CECHY
Kompleksowe opcje okresów
- Niestandardowe okresy minutowe: 25m, 35m, 50m, 55m
- Niestandardowe okresy godzinowe: 5H, 7H, 9H-23H (każda godzina od 5 do 23)
- Niestandardowe dzienne/tygodniowe/miesięczne: 4-dniowe, 2-tygodniowe, 3-tygodniowe, 2-miesięczne, 3-miesięczne, 4-miesięczne, 6-miesięczne, roczne
- Natywne interwały czasowe: Wszystkie standardowe okresy (m1-Miesięczne) z ulepszoną wizualizacją
Niestandardowe słupki czasowe
- Wizualne świece dla niestandardowych okresów z kolorowaniem byczym/niedźwiedzim
- Konfigurowalna grubość knota
- Czysta wizualizacja wykresu — ukryj natywne słupki, pokaż tylko strukturę niestandardowego okresu
- Śledzenie formowania w czasie rzeczywistym
Kontrolki przełączania
- Szybkie przyciski włącz/wyłącz dla niestandardowych słupków, linii OHLC, MA
- Czysty interfejs do szybkiego zarządzania funkcjami
- Elastyczna konfiguracja wyświetlania
__________________________________________________________________________________________
WIĘCEJ DARMOWYCH WSKAŹNIKÓW
Odkryj szeroki zakres narzędzi analizy rynku — od struktury i wolumenu po regresję, zmienność i niestandardowe interwały czasowe.
Kod źródłowy jest dostępny w repozytorium GitHub repository.
Wszystko dostępne za darmo. Ale jeśli chcesz wesprzeć kawą, możesz to zrobić tutaj.
Wsparcie/Oporność
Wolumen
- Profiler aktywności wolumenu
- Analizator efektywności wolumenu
- Analiza profilu wolumenu
- Profil wolumenu - zaktualizowany
- Analiza rozkładu wolumenu
- VWAP (Ważona średnia cena wolumenu)
Średnie kroczące
- Kanał SSL
- Zakotwiczona średnia krocząca
- Średnia krocząca skalowana odchyleniem
- Aktywator Ganna High Low
- Natychmiastowa linia trendu
- Adaptacyjna średnia krocząca Kaufmana z wizją trendu
- Kanał średnich kroczących
- Pakiet średnich kroczących
- Średnia krocząca kanału trendu
Narzędzia/Niestandardowe
Oparte na regresji
Zmienność
Oscylatory
__________________________________________________________________________________________
ZASTRZEŻENIE
Trading wiąże się z ryzykiem. Ten wskaźnik jest przeznaczony wyłącznie do analizy technicznej — zawsze stosuj odpowiednie zarządzanie ryzykiem i handluj odpowiedzialnie.
OPINIE I ULEPSZENIA
Jeśli masz sugestie, prośby o funkcje lub pomysły na ulepszenia, zostaw komentarz na karcie Dyskusja. Twoja opinia pomaga ulepszyć wskaźnik dla wszystkich.
Podsumowanie
Opinie klientów
5 | 100 % | |
4 | 0 % | |
3 | 0 % | |
2 | 0 % | |
1 | 0 % |