Açıklama
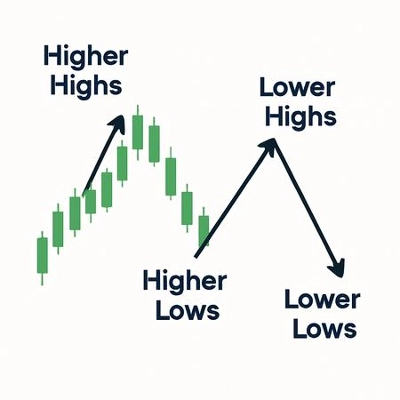
Trend yönü ve yapı analizi için tüm dört OHLC fiyatlarında hareketli ortalamalar kullanan üç renkli uyarlanabilir kanal sistemi.
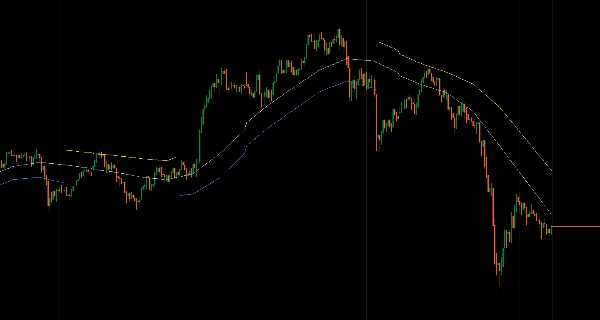
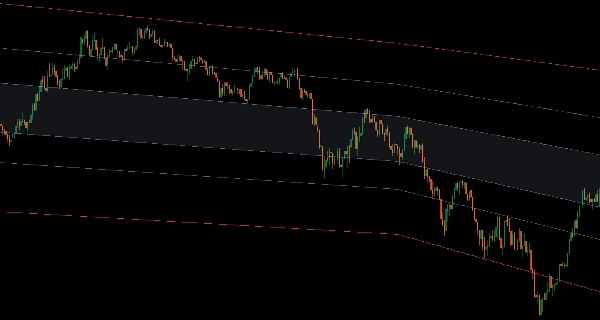
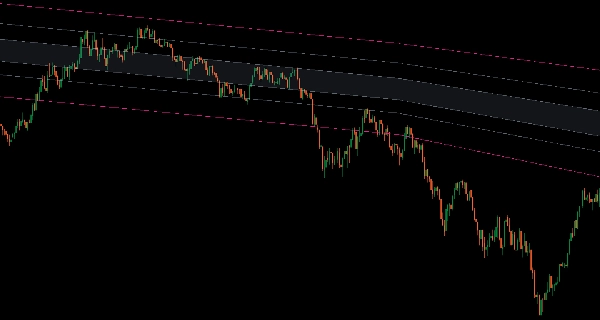
Yüksek/Düşük sınırlarını, Açılış/Kapanış yönsel eğilim çizgilerini ve renk kodlu trend durumlarıyla (Mavi yükseliş trendi, Altın düşüş trendi, Gri nötr) uyumlu olarak değişen Medyan dengeyi gösterir.
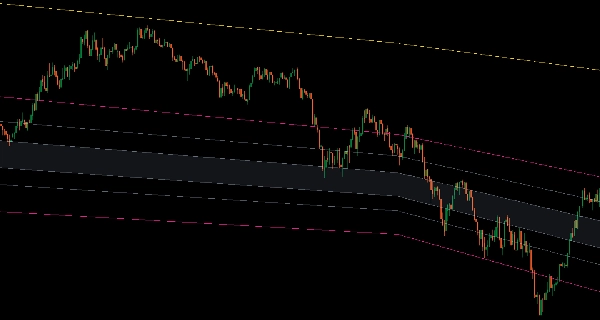
İki görüntüleme modu (tam kanal veya trende dayalı karmaşıklık azaltma), altı isteğe bağlı Fibonacci bölgesi (tam kanal geri çekilmeleri, yarım kanal seviyeleri, kırılma uzantıları), 15 hareketli ortalama algoritması (Arnaud Legoux, Jurik, Hull, KAMA, VIDYA, Sapma Ölçekli, SuperSmoother, Ultimate Smoother, McGinley Dynamic, T3, ZLEMA, Laguerre), çoklu zaman dilimi enterpolasyonu, olay bazlı büyüyen dönemler için çapa tarihi hesaplaması ve trend bazlı çubuk renklendirme, tanımlı sınırlar içinde geri çekilmeleri ve ortalama dönüşü hedefleyen tüccarlar için uyumlu bir kanal yapısı sunar.
ÖZELLİKLER
Üç Renkli Trend Sistemi
- Mavi çizgiler: Yükseliş trendi onaylandı—düşük çizgiye geri çekilmelerde işlem yapın
- Altın çizgiler: Düşüş trendi onaylandı—yüksek çizgiye sıçramalarda işlem yapın
- Gri çizgiler: Nötr/yanlamasına—uçları azaltın, ortayı kazanın
- Tüm çizgiler birlikte uyum sağlar—karışık sinyal yok
Tam Kanal Yapısı
- Yüksek/Düşük çizgiler kanal sınırlarını tanımlar
- Açılış/Kapanış çizgileri kanal içindeki yönsel eğilimi gösterir
- Medyan çizgi (dördünün ortası) gerçek dengeyi işaret eder
- Uyumlu hareket eden entegre yapı
İki Görüntüleme Modu
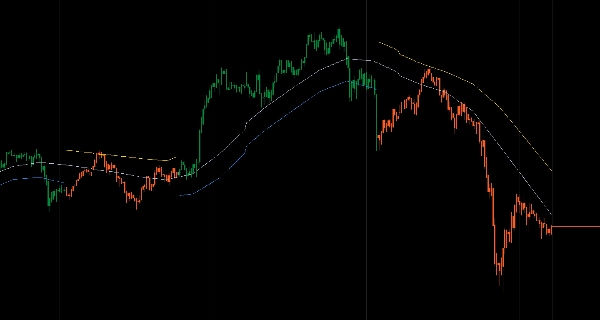
- Kanal Modu: Her zaman her iki sınırı trend renkleriyle göster
- Trende Dayalı Mod: Yükseliş trendlerinde yüksek çizgiyi, düşüş trendlerinde düşük çizgiyi gizler—görsel karmaşıklığı azaltır, işlem yapılabilir sınır üzerinde odaklanmayı sağlar
6 Fibonacci Bölgesi (İsteğe Bağlı)
- Düşük-Yüksek arası (tam kanal geri çekilmeleri)
- Düşük-Medyan veya Medyan-Yüksek arası (yarım kanal seviyeleri)
- Üst/Alt uzantılar (kırılma hedefleri)
- Toplam aralık (alt uzantıdan üst uzantıya)
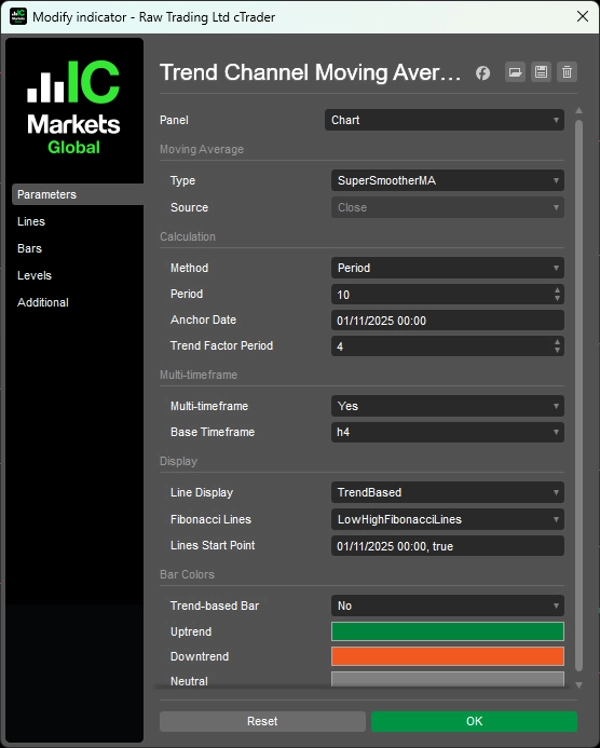
15 Hareketli Ortalama Türü
- Profesyonel algoritmalar: Arnaud Legoux, Jurik, Hull, KAMA, VIDYA, Sapma Ölçekli, SuperSmoother, Ultimate Smoother, McGinley Dynamic, T3, ZLEMA, Laguerre
- Trend tanımlama için optimize edilmiş temiz sinyaller
Gelişmiş İşlevsellik
- Yumuşak enterpolasyonlu çoklu zaman dilimi modu
- Çapa tarihi hesaplaması (belirli olay/seviyeden büyüyen dönem)
- Trende dayalı çubuk renklendirme (isteğe bağlı)
- Çizgi başlangıç noktası kontrolü (geçmiş verileri gizle, sadece güncel yapıyı göster)
__________________________________________________________________________________________
DAHA FAZLA ÜCRETSİZ GÖSTERGE
Yapı ve hacimden regresyon, volatilite ve özel zaman dilimlerine kadar geniş bir piyasa analiz araçları yelpazesini keşfedin.
Kaynak kodu GitHub deposunda mevcuttur.
Kullanımı tamamen ücretsizdir. Ancak kahve desteği göndermek isterseniz, yönlendirebilirsiniz buraya.
Destek/Direnç
Hacim
- Hacim Aktivite Profili
- Hacim Verimlilik Analizörü
- Hacim Profili Analitiği
- Hacim Profili - Güncellendi
- Hacim Yayılım Analizi
- VWAP (Hacim Ağırlıklı Ortalama Fiyat)
Hareketli Ortalamalar
- SSL Kanalı
- Çapalanmış Hareketli Ortalama
- Sapma Ölçekli Hareketli Ortalama
- Gann Yüksek Düşük Aktivatörü
- Anlık Trend Çizgisi
- Trend Vizyonlu Kaufman Adaptif MA
- Hareketli Ortalama Kanalı
- Hareketli Ortalamalar Paketi
- Trend Kanalı Hareketli Ortalaması
Araçlar/Özel
Regresyona Dayalı
Volatilite
Osilatörler
__________________________________________________________________________________________
FERAGATNAME
Ticaret risk içerir. Bu gösterge yalnızca teknik analiz amaçlıdır — her zaman uygun risk yönetimini uygulayın ve sorumlu şekilde işlem yapın.
GERİ BİLDİRİM & GELİŞTİRMELER
Önerileriniz, özellik talepleriniz veya geliştirme fikirleriniz varsa, lütfen Tartışma sekmesinde yorum bırakın. Geri bildiriminiz göstergenin herkes için iyileştirilmesine yardımcı olur.
Özet
Key features include two display modes—full channel and trend-based clutter reduction—and six optional Fibonacci zones covering full and half-channel retracements plus breakout extensions. The system supports 15 professional moving average algorithms such as Arnaud Legoux, Jurik, Hull, KAMA, VIDYA, and others, optimized for clean trend identification. Additional functionalities include multi-timeframe interpolation, anchor date calculation for event-based periods, trend-based bar coloring, and control over line start points to focus on recent data.
This indicator is designed to help traders identify pullbacks and mean reversion opportunities within defined channel boundaries, enhancing decision-making in various market conditions.
Müşteri değerlendirmeleri
5 | 100 % | |
4 | 0 % | |
3 | 0 % | |
2 | 0 % | |
1 | 0 % |